In my yesterday’s video, I showed you how to use Volume Profile when there is a trend.
Today, I am going to give you one more example. I will show you this on the recent development of CHF/JPY.
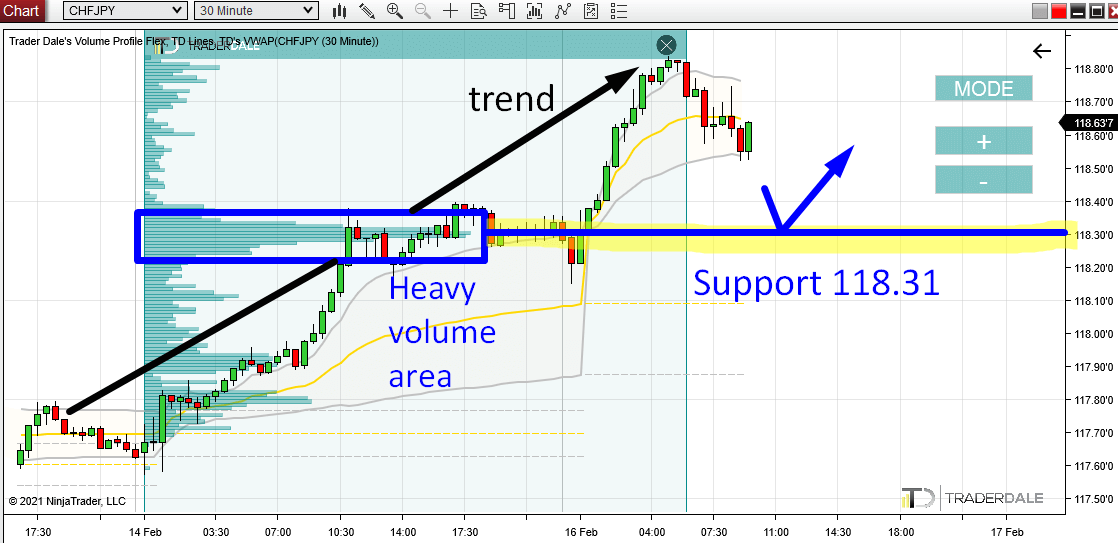
Yesterday, and today the CHF/JPY is trending strongly. There is an uptrend and Buyers are clearly in control.
When there is such a trend, then I use my Flexible Volume Profile to look into the volume distribution within that uptrend.
What I want to see there is some significant volume area (I call these “Volume Clusters”).
Such area often represents a strong Support/Resistance zone.
Volume-based Support Around 118.31
In this case, there was a really strong volume area formed around 118.31. This area indicates, that the Buyers who are pushing the prices upwards were adding massively to their Long positions there.
This is what tells me that this is an important place for them.
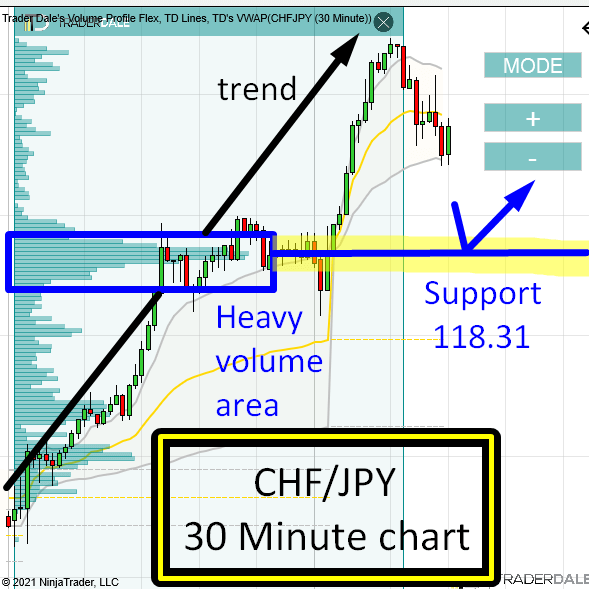
CHF/JPY; 30 Minute chart:

When the price comes back into this area again, it will still (most likely) be an important place for them.
This means they will want to defend it. So, when there is a pullback to 118.31 at some point in the future, then those Buyers are likely to start buying aggressively in order to help the price stay above 118.31 and to push it upwards again.
This is what should make this area a strong Support.
This setup is one of the basic Volume Profile setups, and I call it the “Trend Setup“.
What do you guys think? Did you spot this Support too? Let me know in the comments below!
Happy trading!
-Dale
P.S. There is an upcoming FREE WEBINAR this Thursday 18th Feb. You can enroll by clicking the banner below. See you there!


