
Today, I will do a day trading analysis of EUR/CAD using Volume Profile, Price Action, and VWAP.
I usually start doing my intraday trading analysis using only a simple 30 Minute Price Action chart.
The things that I look for first, are rotation areas (sideways price channels) and strong trends.
Today, I saw both on EUR/CAD. There was a rotation and from that rotation a strong uptrend started.
Volume Profile analysis
Now it is a time to use Volume Profile to see how the volumes were distributed there.
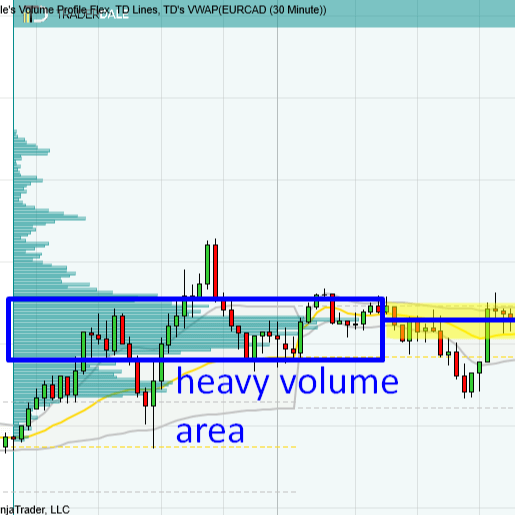
As you can see from the picture below, I stretched my Flexible Volume Profile over the whole rotation area (and also through a part of the trend, but that is not really important).
The Volume Profile showed me how the volumes were distributed there. This way I was immediately able to tell that there were massive volumes traded in that rotation area.
The most important thing in such a heavy volume zone is always the Point Of Control (POC).
POC is the place where the heaviest volumes were traded = the peak.

In this example, there was a rotation followed by an uptrend. This means that buyers were entering their Long positions in that rotation (creating those heavy volumes we see on Volume Profile).
Then those buyers started an aggressive buying activity (using Market orders) and they pushed the price upwards (into the uptrend).
When the price makes it back into the heavy volume zone again (sometime in the future), I expect that those buyers who were building up their Long positions there will become active again and that they will push the price upwards from there again.
That’s why I think the POC at 1.5369 is a strong support.
Price Action analysis
Another thing to notice is visible when you zoom out the chart a bit and use higher time frame (I used 60 Minute).
It shows that the price was reacting really nicely to this 1.5369 area before. Whenever the price reached this area, it bounced off it. It worked as a strong Resistance.
Now, when the price went through this Resistance, the Resistance turned into a new Support.
This is my favorite Price Action setup. You can read more about it in this article:
PRICE ACTION: Support becoming a Resistance (and vice versa)
This Price Action setup gives me a nice confirmation of the Volume-based setup I talked about earlier.

Do you want ME to help YOU with your trading?
VWAP analysis
There is also one more bonus to all this. It is visible on the VWAP indicator.
Below is the same 60 Minute chart, but this time let’s have a look at the VWAP.
My most favorite VWAP for intraday trading is the Weekly VWAP and its Deviations (the “grey lines”).
Those “grey lines” work as Supports and Resistances on their own. Currently, the lower 1st Deviation is almost at the support I talked about (1.5369 area).
This means that also the VWAP indicator tells us that there is a support in that 1.5369 area.
If you would like to learn more about VWAP trading setups, you can do so here:
Below is the 60 Minute chart with the 1st VWAP Deviation:

Recommended Forex Broker
Conclusion
As you can see, we found a trading level which is confirmed by three completely different trading strategies/tools.
The 1.5369 Support showed on Volume Profile, on Price Action, and also on VWAP. That’s how I like it. The more confluences, the better!
Can this level fail? Sure it can! Even if we had all the confluences we could think of it could still fail. The market could change its sentiment dramatically and the price could just shoot past this support without any reaction. Things like this do happen.
There is no strategy that would work 100%, but doing a proper analysis like this one, using multiple confluences with different trading approaches/indicators makes the chance of a successful trade higher.
That’s what trading is all about. Having the probability on your side means having an edge. This edge helps you being consistently profitable in the long run.
I hope you guys liked today’s analysis. Let me know what you think in the comments below!
Happy trading,
-Dale
Thank you Mr. Dale; It is really so nice analysis .
Thanks for feedback, I’m glad you like it!
Thanks Dale. It was very well explained.
Would it be possible to do analysis for USD/CAD.
Thanks in advance.
Sandip
You’re welcome. I will definitely check it and if there is any interesting level I’ll do it.
Thank you Mr. Dale. I am learning from your analysis and this helps me a lot. Appreciate it.
Hello, I’m glad you like it and it helps you!
thanks indeed,
You’re most welcome.