Today, I will focus on the intraday analysis of the EUR/GBP. What caught my eye here was a rotation from which a strong sell-off started yesterday.
Why it caught my eye? Because in a rotation, heavy volumes are usually traded (accumulated). Big trading institutions need a rotation to accumulate their big trading positions. They need time and liquidity. The rotation takes some time so that suits them. When a price rotates then it also means that the market found its fair price (fair value) – at least temporarily. And this means traders are willing to buy and sell there = there is liquidity.
When there is a sell-off after such a rotation, then it indicates that the big guys (institutions) were building up their positions in that rotation. They were doing so unnoticed and without their intentions being revealed. After that, they started manipulating the price aggressively (with market orders) to start a trend.
Volume Profile analysis
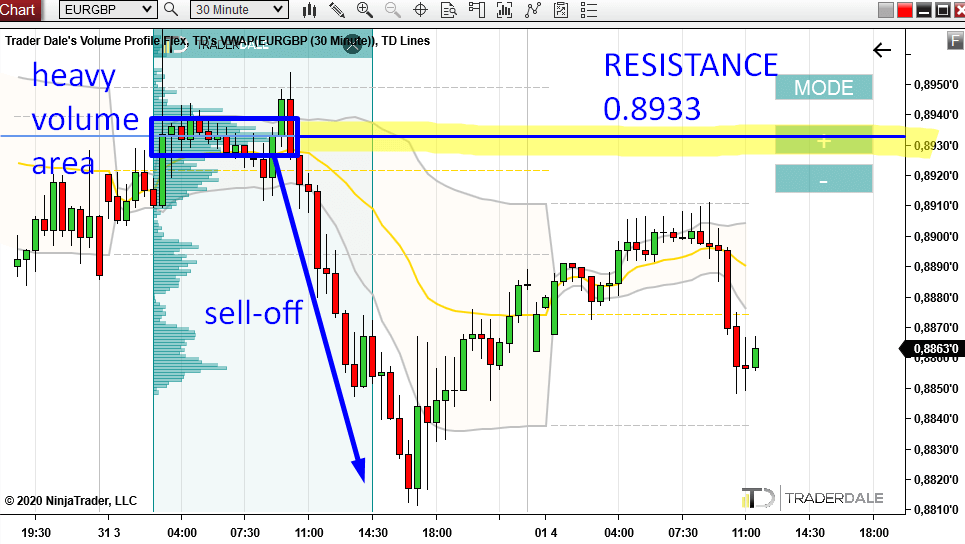
When I see a rotation from which a trend starts, then I look into that rotation using my Flexible Volume Profile. I look for a place where the volumes were the heaviest because this is the place where the big guys placed most of their positions. This is an important place, because when the price makes a pullback into this area again, then it is likely that those big guys will start defending their positions.
How will they defend them? They will start to sell aggressively again to push the price downwards. And that’s what I want to see. That’s what I want to participate in!
So, what I do is that I wait for the pullback and then enter a short from the place where they accumulated most of their positions. In this case, it is 0.8933. This is currently the strong intraday resistance on EUR/GBP.
You can see it in the picture below.
EUR/GBP; 30 Minute chart:
Do you want ME to help YOU with your trading?
VWAP analysis
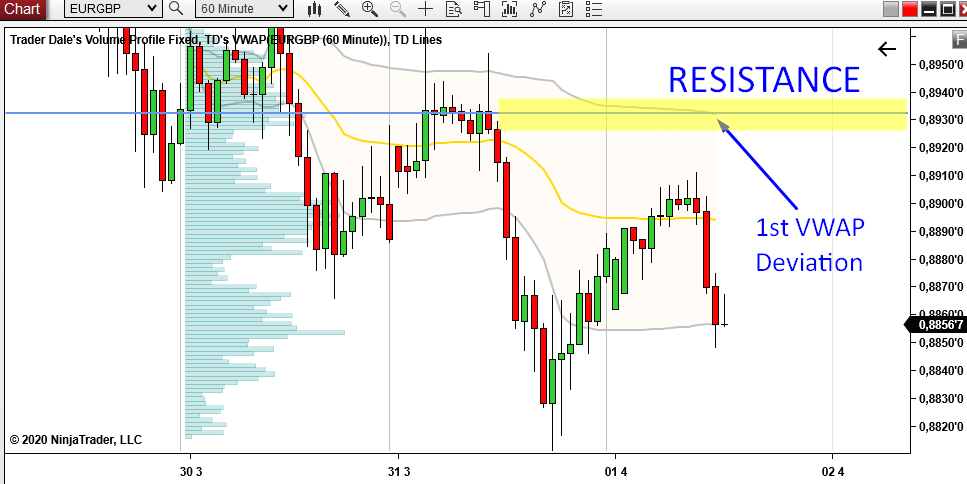
There is one more thing I like about this 0.8933 resistance. The thing is a VWAP Trend Setup. With this setup you want to see the 1st VWAP deviations go sideways and you use them as support and resistance zones.
As you can see from the picture below, the 1st Deviation (the upper grey line) is moving sideways and it is currently exactly at the 0.8933 resistance. If it stays somewhere around this area then it will be a very nice confirmation of the volume-based level.
In the picture below I am using the Weekly VWAP. I find its signals stronger then the Daily VWAP. I like trading with the Weekly VWAP more then with the Daily.
BTW you can learn more about my VWAP setups in this webinar recording:
EUR/GBP; 60 Minute chart, Weekly VWAP:
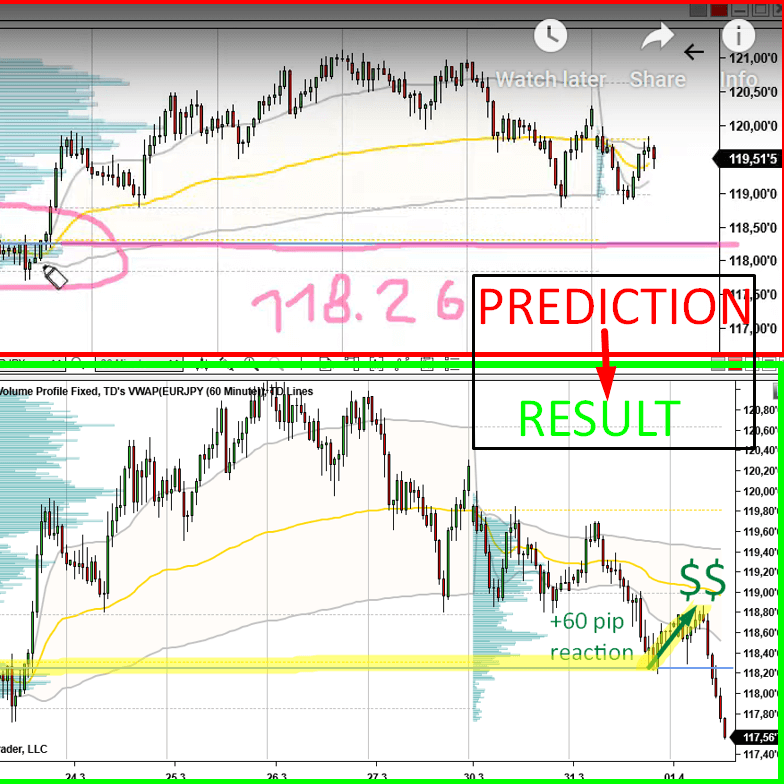
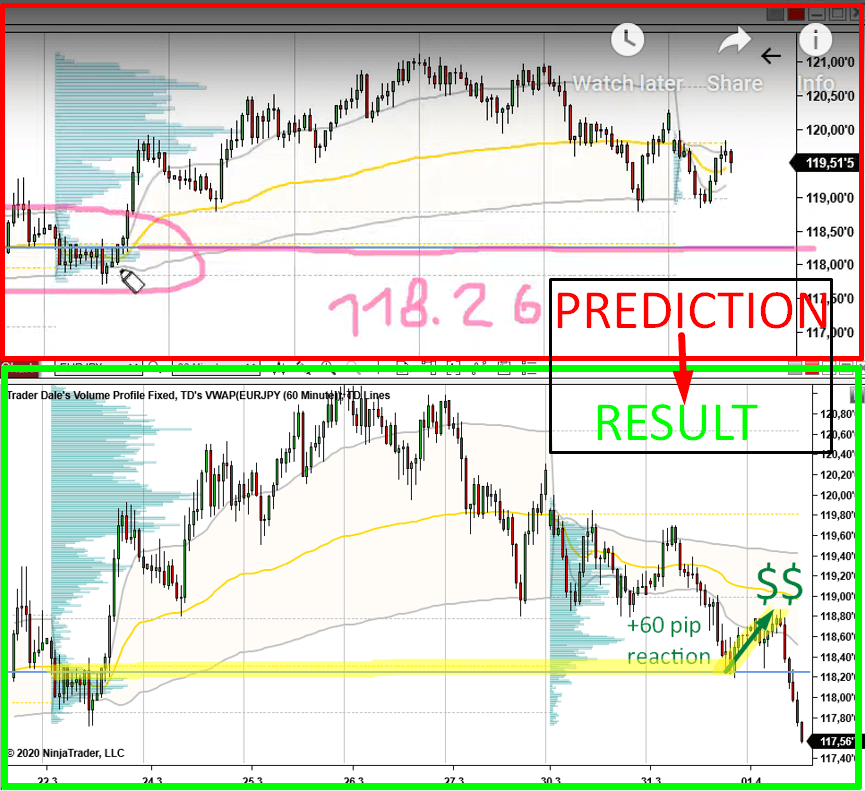
EUR/JPY Prediction→Result
Did you watch my recent Weekly Trading ideas video? I made a prediction on EUR/JPY there. This prediction was based on the same setup as I showed you today (I call it the Volume Accumulation Setup). I was talking about a strong support at 118.26.
Upper picture is the prediction and the lower is a screenshot of the result. Nice and precise 60 pip reaction!
You can watch the whole video here:
I hope you guys liked today’s intraday analysis. Let me know what you think in the comments below!
Stay safe and happy trading!
-Dale