
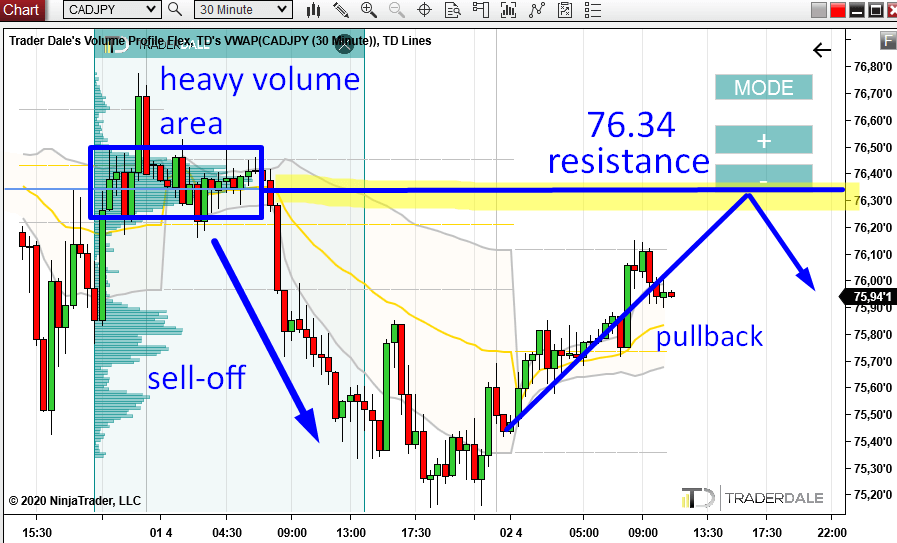
Let’s have a look at the CAD/JPY, intraday chart analysis today, okay? There was a nice rotation followed by a strong sell-off in the European session.
I used my Flexible Volume Profile to look inside the rotation and I found what I expected – heavy volumes accumulated there. So to me, it seems that sellers were accumulating their shorts in this area at the end of the US session and in the Asian session.
What they did next was that they started a sell-off. That’s how institutions work. They accumulate their positions without being noticed in a rotation and then they start a trend. It is the same thing over and over again. It is the trend where they are making money from the positions they accumulated in the rotation.
As you can see from the picture below, the price is slowly getting back into the rotation area again. To the area where the sellers entered their short positions.
CAD/JPY; 30 Minute chart:
What will happen when the price gets there?
Two factors to push the price down
1) The sellers will want to defend their shorts. They have two options – to fight or let their shorts run into red numbers. So, yeah – they will fight! They will try to push the price downwards again. They will do it by sell market orders (aggressive orders).
2) Another thing that will happen is that the buyers who are currently pushing the price upwards (pullback) will be afraid to fight the sellers. Those buyers are not stupid, they know about the sellers and their heavy volumes accumulated around 76.34. So instead of risking a fight, these buyers will back off. They will get rid of their longs. Where? At the resistance (which is the heavy volume area).
Do you want ME to help YOU with your trading?
What if buyers become aggressive?
What could also happen is that there could be some fundamental change in the market sentiment and that the buyers will actually want to fight with the sellers no matter what. They would start aggressively pushing the price upwards by market buy orders and if they are strong enough they push through. This would mean the resistance would get broken.
In a case like this it is best to use a Reversal trade strategy (enter a Long). More about this strategy here:
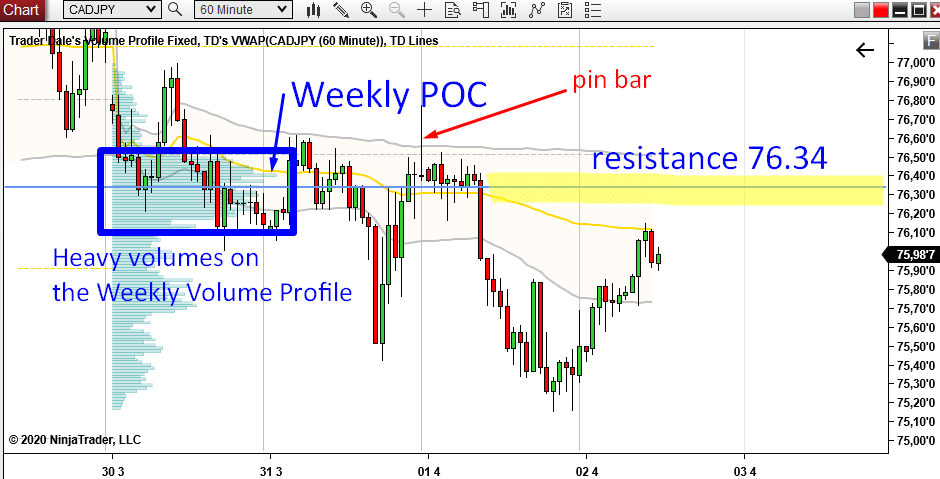
Weekly POC
Let’s now get back to the chart because there are two more things I wanted to show you there. The first thing is a Weekly Point Of Control. This POC is very close to the resistance we found (76.34). It tells us that there were massive volumes accumulated throughout this whole week there. This adds to the strength of the resistance level.
Pin bar
The second thing is just a little confirmation, but still it is worth noticing. It is the pin bar created within the rotation area. This pin bar shows the aggressivity of the sellers who rejected higher prices (when the price was rotating and sellers were accumulating shorts)
I hope you guys liked today’s analysis. Let me know what you think in the comments below!
Stay safe and happy trading!
-Dale