Today I would like to have a closer look at the EUR/GBP using the VWAP indicator.
I am interested in intraday trading levels, so I am going to start with a zoomed out 60 Minute chart which enables me to see the bigger picture.
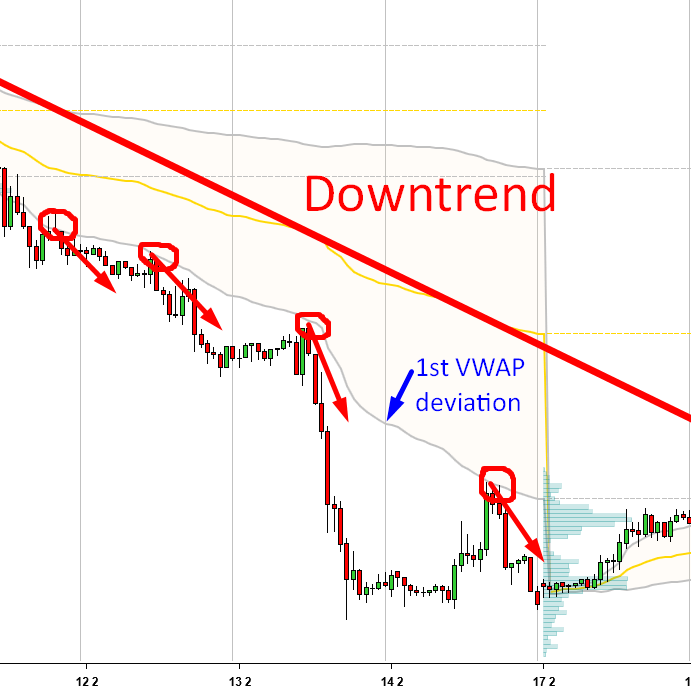
In the picture below you can see than there is a nicely visible downtrend. You can tell by looking at the simple Price Action.
Another way how to tell whether there is a trend or no is the VWAP. I dare to say that VWAP is a faster and more reliable way. The reason is that VWAP is calculated using Price and Volumes. What you want to see in a downtrend is not only price going down, but also volumes shifting downwards. If there is a downward movement without Volumes, then it lacks strength!
How do you tell if there is a trend using VWAP?
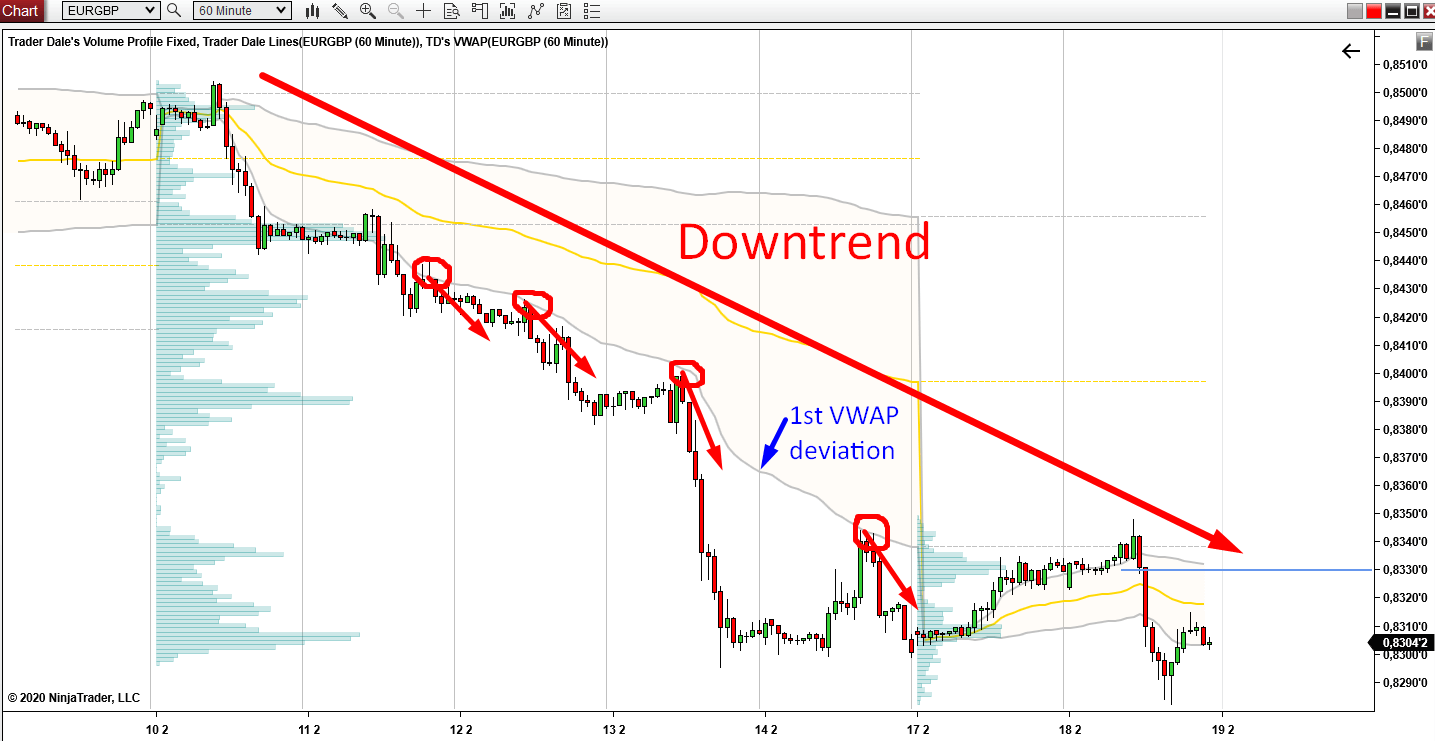
It is pretty simple. When the two grey lines (1st deviations of VWAP) start moving upwards or downwards, there is a trend. If they move horizontally, then there is a sideways rotation.
If you look at the picture below, you can see that the 2 grey lines were moving downwards in the previous week (= downtrend).
Another nice thing worth pointing out is the reactions of the price to the 1st Deviation. When there is a downtrend then the price moves below the 1st Deviation line and reacts to it from below.
I marked those reactions with red circles and arrows.
Do you want ME to help YOU with your trading?
VWAP and Rotation
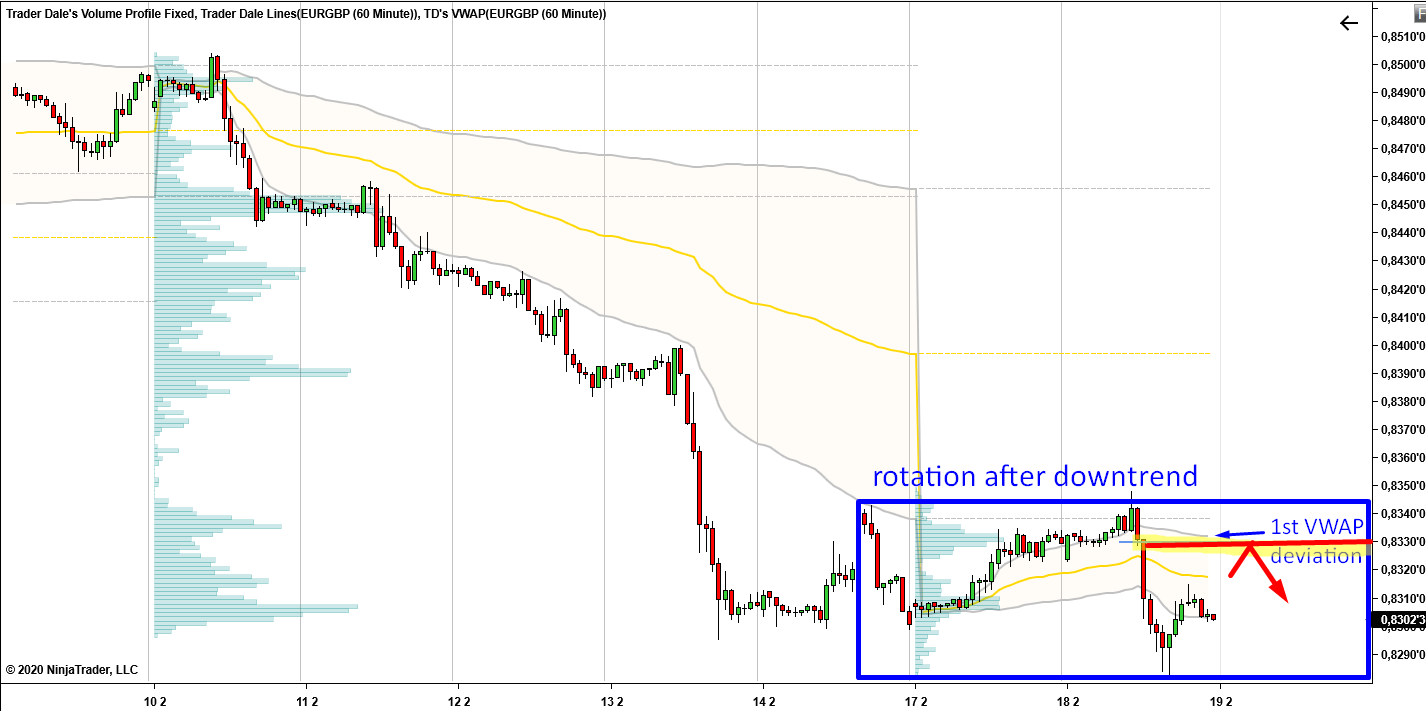
Right now it seems that the downtrend is over (at least temporarily).
The price started to rotate.
Weekly VWAP and it’s 1st Deviation move sideways. When there is a rotation, then 1st VWAP deviations work as supports and resistances.
After such downtrend, I am not really into longs and I look for short trading opportunities only.
If you look at the picture below, there is the 1st Deviation of VWAP in the higher part of the rotation (good area for shorts).
Volumes
The reason this Resistance caught my attention is not just because of the VWAP Deviation and Price Action.
Those of you who know me for some time know that I always want to see some heavy volumes at the support/resistance levels.
The thing I like about this trading level is that there actually are pretty heavy volumes there! Actually, there is a Volume Profile trading setup, which I call the Volume Accumulation Setup.
With this setup you want to see a price rotation, which is followed by buying or selling activity. Heavy volumes in the price rotation work as a resistance.
Below, there is the same chart, only zoomed in a bit, with 30 Minute time frame (*with Daily VWAP ):

Recommended Forex Broker
To sum this up
There is a strong resistance around 0.8330.
Reasons:
1) Downtrend on EUR/GBP (I am looking for shorts).
2) 1st Deviation of Weekly VWAP is a resistance.
3) This resistance from the 1st Weekly Deviation is confirmed by heavy volumes (that’s the last picture).
When the price returns back to this area I think that there is a solid chance that strong sellers will defend the 0.0.8330 zone and they will try and push the price downwards again!
I hope you guys like this! Let me know what you think in the comments below!
Happy trading!
-Dale
Good job i like
thanks!