I received an email from a member of my Volume Profile Training Course yesterday. He was asking about my opinion on a resistance he found using Volume Profile.
I really liked his level so I decided I will publish it here for you and say a few words about it.
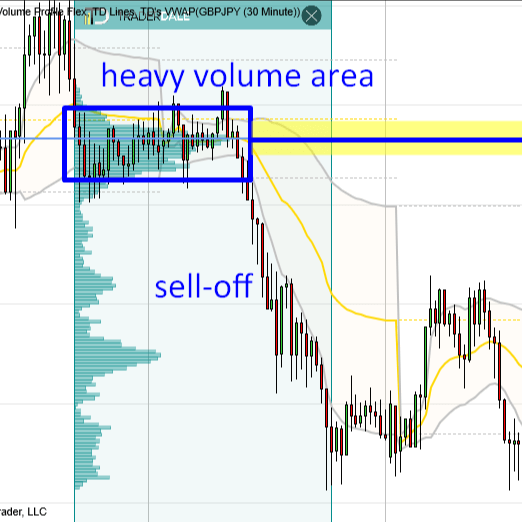
So, this level is an intraday resistance on GBP/JPY which he found on a 30 Minute chart using the Flexible Volume Profile tool.
Reasoning behind the resistance
On Thursday and Friday, there was a tight price rotation. Then, from this rotation, a strong sell-off started.
When you look into the rotation using Volume Profile, you will see that there were massive volumes accumulated there.
Those volumes were most likely positions of strong institutional sellers who were entering their short trades there. Why do I think it was sellers? Because of the sell-off that followed the volume accumulation.

Recommended Forex Broker
So, we have sellers who were accumulating shorts and then they started sell-off.
What now? Now this place (133.10) became a resistance which we can trade.
The reason is that those sellers who were building up their shorts there should defend this resistance when the price gets near again. This should drive the price downwards from this resistance.
GBP/JPY characteristics
GBP/JPY is in my experience a pretty wild, volatile and sometimes a bit unpredictable pair. For this reason I suggest to be cautious when trading this.
If there is a spike move (a rapid price movement) going against this level I suggest only to use smaller trading position as the price could get wild here and overshoot this resistance without any reaction.
If such trading level was for example on EUR/USD then I would not be so cautious as with GBP/JPY.
I hope you guys liked today’s analysis! Let me know what you think in the comments below.
Happy trading!
-Dale
“The reason is that those sellers who were building up their shorts there should defend this resistance when the price gets near again.”
Something to think about is there may be an institutional seller with iceberg orders, absorbing everything the buyers have (such orders won’t show up on the limit order book). The price went up until the market ran out of buyers (or were absorbed), and the institutions started selling their accumulations at a premium price. In the institutional world, there is no such thing as support or resistance, only premium and discount pricing, driven by value.
Gold Eggs? 🙂
Who knows the reason why the price moves Up, down? There is no right guess if we don’t see much to the left graf patterns. And we don’t see it in the picture.
There are many hedge positions, defense of naked options, etc etc ….
Cable / Yen, is grail for green cowboys. He sees hundreds of pips. Cheering in the kitchen 🙂 It ends with a big cry 😀
For this pair, you need to have an excellent trending system, a lot of free stoploss. That’s why Vegas laugh in the kitchen 🙂
Cable/Yen is empty wallet speed , and researchers trade reflections pusch death here, 🙂 about dreaming speedy yachts .-)
Yes, you are right!
That’s why I wrote in this article that the gbp/jpy was wild, volatile, and sometimes unpredictable.
It’s way better to stick with majors, and that’s why I also prefer them in my trading.