
Have you ever wondered why price keeps bouncing off the same level again and again? The answer is often hiding inside an order flow volume cluster. This is a spot on your chart where big trading institutions were extremely active, and it tends to act as strong support or resistance later on. In this article, you will learn a simple way to find these zones and use them as a trade filter for pullback entries.
You do not need Bid and Ask data to do this. All you need is a clean Order Flow chart and a bit of practice spotting dark, heavy volume areas inside a trend or inside a rejection. Once you know what to look for, reading an order flow volume cluster becomes fast and almost automatic.
We will walk through real examples on the 30 minute time frame, cover long setups, short setups, and rejection setups, and explain exactly how many candles you should wait for confirmation before trusting the signal. By the end of this guide, you will have a repeatable checklist you can apply the next time you open your charts and look for big player confirmation at a key level.
Quick Summary
- An order flow volume cluster is a dark, heavy volume zone that forms during a trend or a rejection.
- It marks a place where big institutions were actively buying or selling.
- Price often returns to this zone later and reacts, which creates a pullback trade.
- You want to see price move away from the cluster first, then come back to test it.
- Wait for at least two full footprints of price action above or below the cluster before trusting the pullback.
Table of Contents
1. What Is an Order Flow Volume Cluster
An order flow volume cluster is simply a spot on your chart where a large amount of volume was traded in a short space of time. On most Order Flow platforms, this shows up as a dark shaded area. The darker the shade, the heavier the volume that changed hands there.
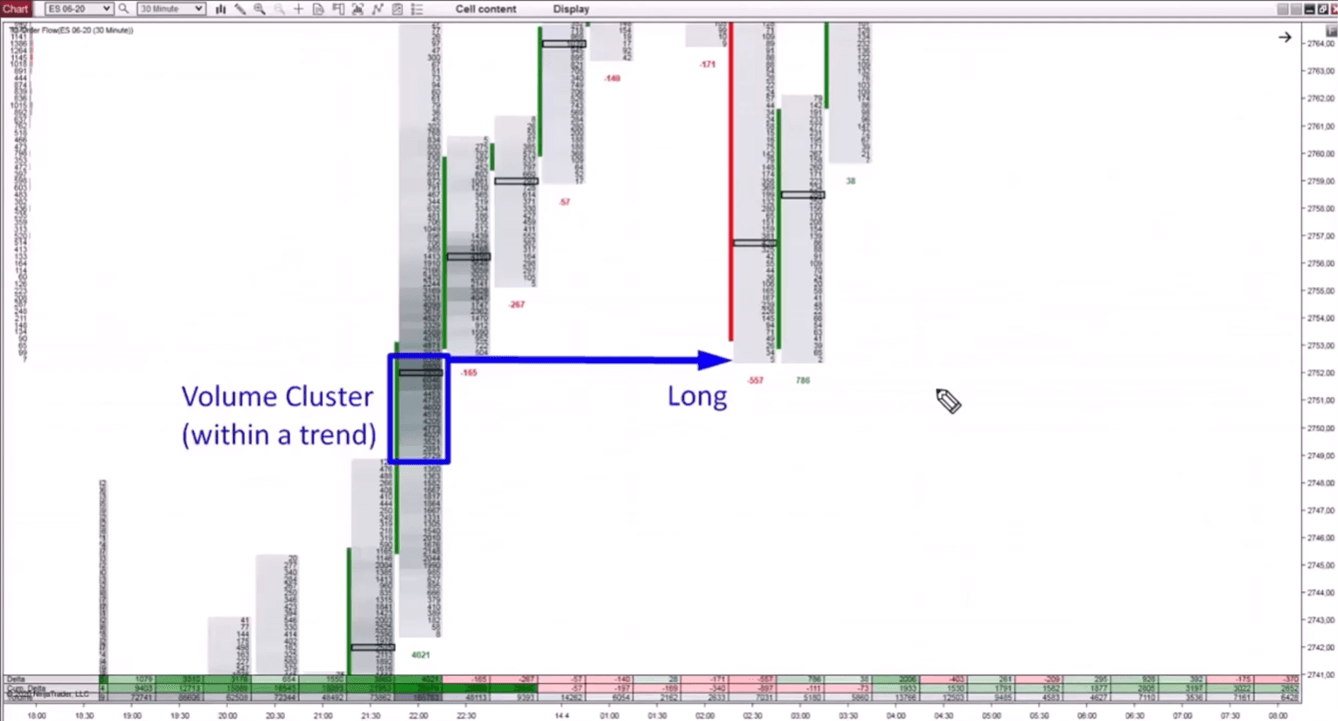
This setup uses total volume only, so you do not need Bid and Ask data at all. That makes it beginner friendly and easy to apply, since you are only reading shades of gray rather than trying to interpret complicated order book numbers.
Best Time Frame for This Setup
The order flow volume cluster strategy works best on a 5 minute to 60 minute chart. A 30 minute time frame tends to give the cleanest results because it filters out a lot of the small, noisy trades while still showing you clear institutional footprints. On this time frame, one candle usually contains enough volume to show a proper cluster without being too slow to react to.
When you scan a chart for this setup, you are looking for one specific pattern. Inside a clear trend, find a candle or a small group of candles that are noticeably darker than the ones around them. That darker area is your volume cluster, and it tells you that big trading institutions were placing large orders at that price. Once price moves away from that zone and later returns to test it, you have the beginning of a valid trade setup.
2. Why Price Reacts to an Order Flow Volume Cluster
This is the part that most traders skip, but it is the reason the whole strategy works. A volume cluster is not just a random spot on the chart. It represents a place where institutions committed real size to their positions. These are not small retail orders. These are large blocks of volume from banks, funds, and other big players.
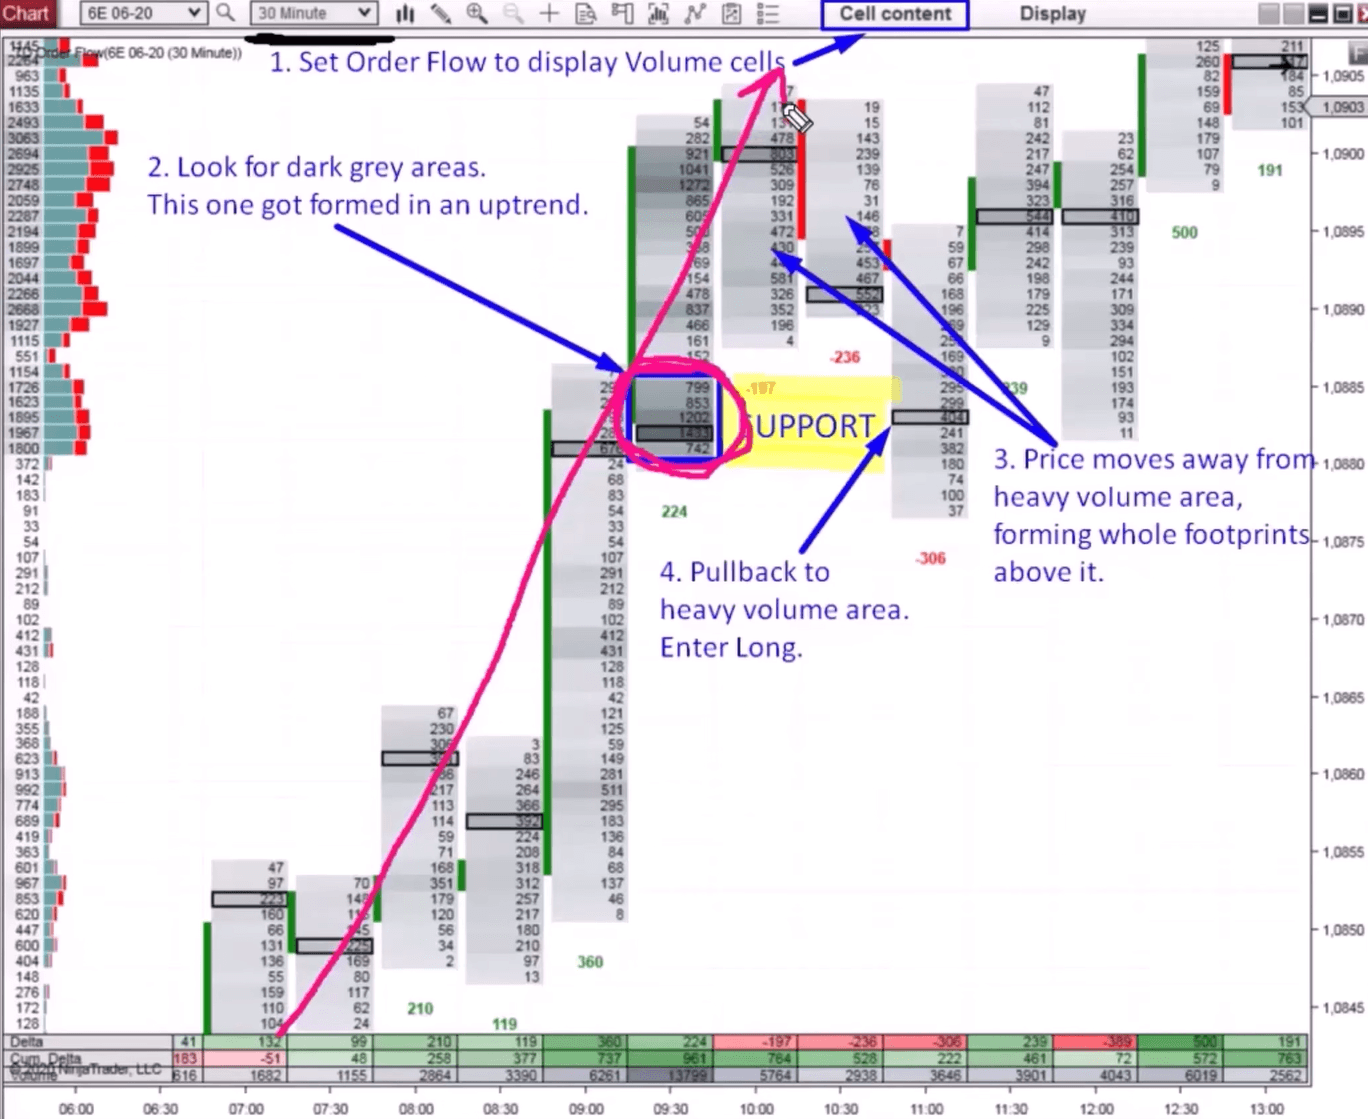
Because these institutions built a position at that level, they have a strong reason to defend it. When price pulls back to that zone, it is essentially returning to the doorstep of the traders who created the original move. Those traders often step back in, add to their position, and push price away again in the same direction as before.
The Logic Behind Institutional Defense
Think about it from the institution’s point of view. If a fund bought a huge amount of volume at a certain price during an uptrend, that price now matters to them. If the market comes back down to that same level, it gives them a chance to add more size at a price they already believe in. This buying pressure is what pushes price back up and creates the reaction you see on the chart.
This is also why the setup fails less often than a random support or resistance line drawn by eye. You are not guessing where big players might be interested. You are looking directly at a spot where they already showed up with real volume. That is a much stronger form of big player confirmation than price action alone.
3. How to Trade an Order Flow Volume Cluster in an Uptrend
Trading a long setup with an order flow volume cluster follows a clear, repeatable process. First, identify a strong uptrend on your 30 minute chart. Within that uptrend, look for a dark volume cluster, a spot where buyers were clearly adding to their long positions in size.
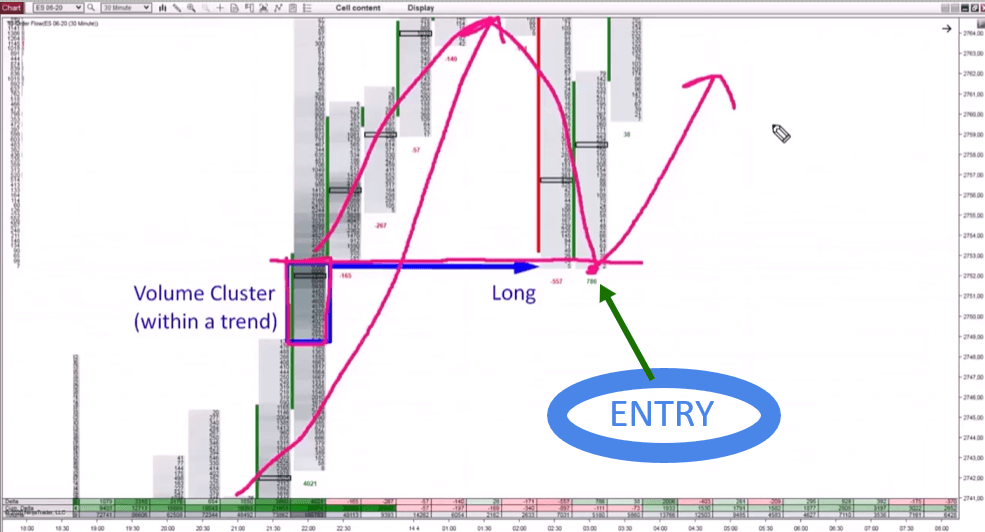
Once you spot the cluster, mark the beginning of that zone on your chart. This is the level you will use for your entry, not the middle or the top of the cluster. After marking it, wait for price to move away from that level and continue higher. This confirms that buyers were strong enough to push price further after building their position.
Waiting for the Pullback Entry
The next step is patience. You now wait for price to pull back down and touch that marked level again. Since this is an uptrend, you are only interested in long entries from this zone. When price returns to the beginning of the cluster, that is your signal that big buyers are likely to step back in and defend their position.
This works because the heavy volume zone represents a real commitment from institutions, not just a random price level. When price makes a pullback to this zone, which is clearly important for those buyers, they often become active again and push price upward, away from the positions they originally built there. That reaction is exactly what you are trading. A good example on a real chart often shows a beautiful, sharp bounce the moment price touches the marked zone, which is a strong sign that the setup is working the way it should.
4. How to Trade an Order Flow Volume Cluster in a Downtrend
The short setup mirrors the long setup exactly, just in the opposite direction. In a downtrend, you are looking for sellers who were actively adding to their short positions. This shows up as a dark order flow volume cluster formed while price was dropping.
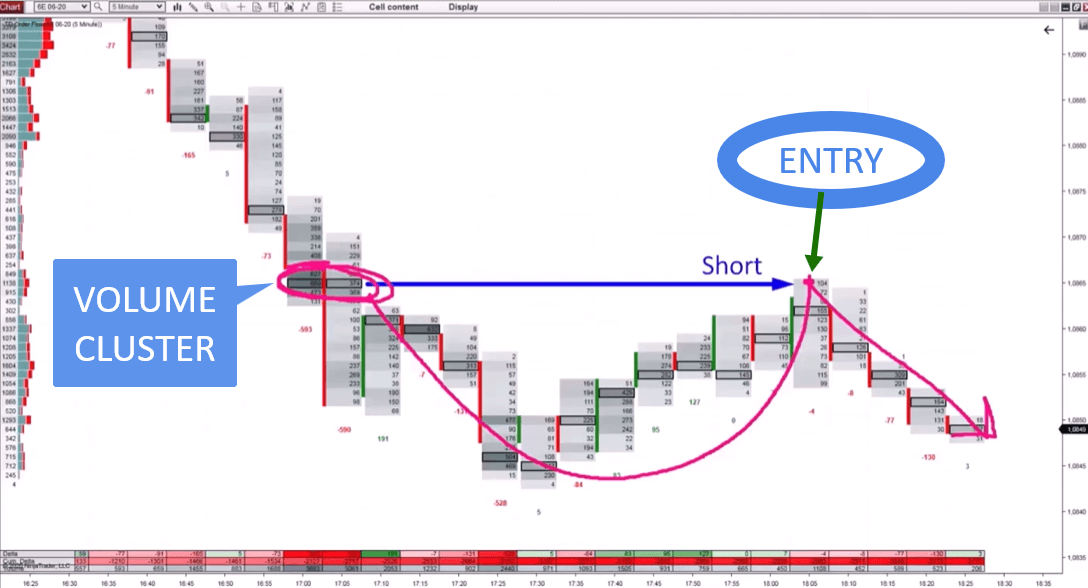
Sometimes you will see two separate volume clusters close together within the same downtrend. When this happens, it actually adds strength to the zone, since it shows repeated institutional selling in a similar area. This gives you extra confidence that the zone is significant.
Confirming the Short Entry
Just like with the long setup, you mark the zone, then wait for price to move away from it before trusting the level. Once price has clearly separated from the cluster, you wait for a pullback higher, back into that same zone. When price reaches it, you are looking to go short in the direction of the original trend.
The sellers who pushed price down originally were active in this zone, adding to their shorts. This makes it an important level for them. When the pullback happens, those same sellers tend to defend their position and push price back down again. This is the same institutional logic from the uptrend example, just applied to the sell side of the market.
5. Finding an Order Flow Volume Cluster Inside a Price Rejection
A rejection is a very specific and powerful chart pattern. It happens when price moves aggressively in one direction, then sharply reverses and moves aggressively the other way. Somewhere close to the exact point where price turns, you often find a strong order flow volume cluster.
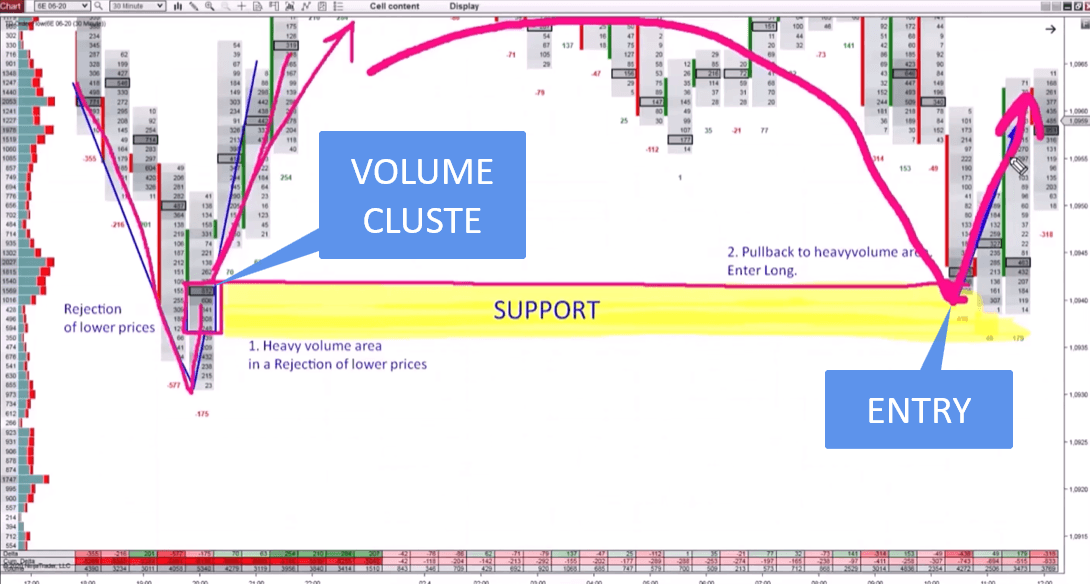
This cluster represents the exact moment where the balance of power shifted. For example, in a rejection of lower prices, this is the point where buyers started absorbing everything that sellers were offering, which then created strong buying pressure that pushed price upward from there. This makes it the single most important zone within the entire rejection pattern.
Trading the Rejection Pullback
The process for trading this setup is the same as before. You mark the beginning of the cluster inside the rejection, wait for price to move away, and then wait for the pullback to test that zone again. If the rejection pushed prices higher, you look to go long on the pullback. If the rejection pushed prices lower, you look to go short on the pullback.
One important rule applies here. If you look at a rejection and you do not see any heavy volume cluster within it, you should simply skip the trade. Without that institutional footprint, you have no real confirmation that big players were involved, and the setup loses most of its edge. The heavy volume is not optional. It is the entire reason this strategy has an advantage over simply drawing support and resistance lines by hand.
Setup Type | Trend Direction | Cluster Location | Trade Direction on Pullback |
Trend Continuation | Uptrend | Inside the trend | Long |
Trend Continuation | Downtrend | Inside the trend | Short |
Rejection | Reversal from lows | Near the turning point | Long |
Rejection | Reversal from highs | Near the turning point | Short |
6. How Long Should You Wait for the Pullback
Timing matters just as much as the location of the order flow volume cluster. A common question is whether the pullback needs to happen the same day, or whether it can happen later. In most cases, the pullback should occur within the next couple of days, with two weeks being a reasonable maximum. Beyond that window, the zone tends to lose its relevance and the setup is usually skipped.
There is also an important confirmation step before you trust the setup. Price should show some clear movement away from the volume cluster before the pullback happens. This is not an instant test of the zone right after it forms. On a 30 minute chart, a good rule of thumb is to wait for at least two complete footprints, meaning two full candles of price action, above the cluster in an uptrend or below it in a downtrend, before considering the pullback valid.
Why This Confirmation Step Matters
Skipping this confirmation step is one of the most common mistakes traders make with this strategy. Without enough separation between the cluster and the pullback, you cannot be sure that the zone was actually respected as a real level. The two footprint rule gives the setup enough breathing room to prove itself before you risk capital on it. It is a simple filter, but it removes a large number of low quality signals and keeps you focused on the clusters that matter most.
Conclusion
Reading an order flow volume cluster does not require years of experience or complicated software. What it takes is a trained eye for spotting dark, heavy volume zones inside a trend or inside a rejection, along with the patience to wait for a proper pullback before entering a trade.
Throughout this guide, you learned how to identify a cluster in both uptrends and downtrends, how to spot one hiding inside a sharp rejection, and how long you should reasonably wait before trusting the pullback signal. You also learned why these zones work in the first place. They mark real institutional activity, and big players tend to defend the positions they built there.
The next time you open your charts, try scanning a recent trend for a volume cluster and mark its starting point. Watch how price behaves the next time it returns to that level. With a bit of practice, spotting these zones becomes fast, and you will start seeing them across almost every chart you open.
Frequently Asked Questions
Do I need Bid and Ask data to trade an order flow volume cluster?
No. This setup only uses total volume shading, which makes it accessible even without advanced order book data.
What time frame works best for this strategy?
Anything between 5 minutes and 60 minutes can work, though a 30 minute chart tends to give the cleanest and most reliable clusters.
What if a rejection has no visible volume cluster?
Skip the trade. Without a heavy volume zone, there is no institutional confirmation, and the setup loses its edge.
Ready to Start Reading Order Flow Like a Big Player?
- Watch the full video breakdown above and start marking your own volume clusters on your next trading session.
- Combine this filter with our Volume Profile pullback strategy using Anchored VWAP for another way to confirm big player activity.
- See our Orderflow and Volume Profile courses for more pullback ideas rooted in institutional footprints.
