
In this article, I draw on my years of experience as a professional trader to show you how to simplify your market analysis and truly understand how to read any trading chart. Many beginners feel like they are looking at a foreign language when they first open a trading platform. They see red and green candles jumping up and down and feel an immediate urge to click buttons without a plan. This is exactly what the “big players”—the major banks and institutions—want you to do. They thrive on the confusion of retail traders.
The truth is, market movement isn’t a mystery. It is a reflection of human psychology and institutional activity. You will learn that every market movement, regardless of the asset, boils down to just two distinct phases. Once you learn to recognize these phases, the “noise” of the market disappears, and a clear path forward emerges. We will cover the specific strategies for each market phase, explain why the 70/30 rule is the backbone of professional trading, and introduce you to the Volume Profile—a tool that acts like an X-ray for the market. By the end of this guide, you will have a structured, professional framework for looking at any price action with total confidence.
Table of Contents
5 Key Takeaways
Two Phases: All charts consist of either Rotations (sideways) or Trends (up/down).
Timeframes Don’t Matter: This logic applies to 30-minute charts and daily charts alike.
The 70/30 Rule: Markets rotate 70% of the time and trend only 30% of the time.
Strategy Shift: You must use different strategies for rotation (trade the edges) vs. trends (trade the pullbacks).
Follow the Money: Use Volume Profile to find where institutional banks are placing their trades.
The Secret to Understanding Market Structures
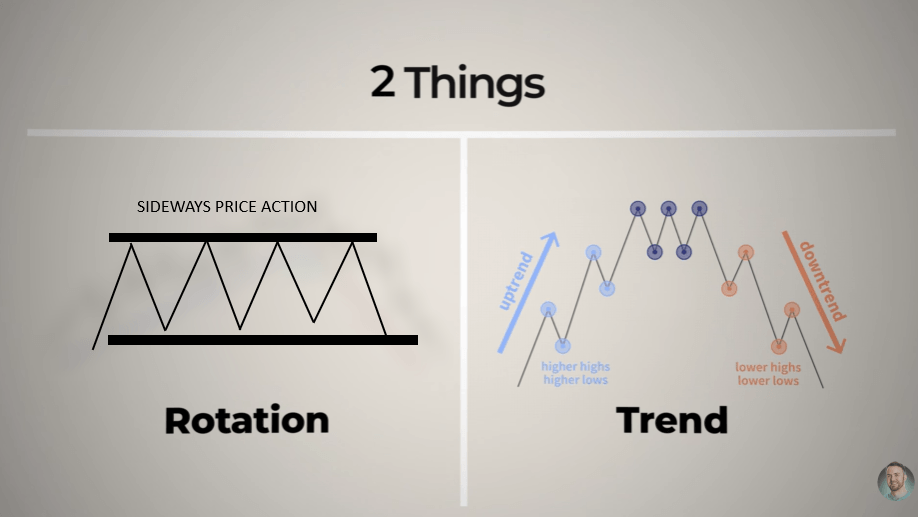
To learn how to read any trading chart, you first need to stop looking at the noise and start looking at the shape of the price. Many new traders get overwhelmed by dozens of indicators, colorful lines, and complex math. However, the most successful traders know a secret: the market only does two things. It is either moving sideways in a “rotation” or moving aggressively in a “trend.”
Think of a rotation like a person pacing back and forth in a room. They aren’t really going anywhere; they are just waiting. In trading, this happens about 70% of the time. This is when the buyers and sellers are in a state of balance. Neither side is strong enough to push the price to a new level, so the price bounces between a ceiling (resistance) and a floor (support).
Why the 70/30 Rule Matters
Most traders lose money because they try to use trend-following indicators (like Moving Averages) while the market is just moving sideways. If the market is rotating 70% of the time, and you are using a strategy built for the other 30%, you are fighting an uphill battle. Professional trading is about identifying which “mode” the market is in before you put your money at risk. When you understand that balance is the default state of the market, you stop forcing trades in the middle of nowhere and start waiting for the market to reveal its true intentions. This statistic is the foundation of patient, expert trading.
Identifying the Shift
The most important skill you can develop is the ability to look at a chart—whether it is the EUR/USD, Bitcoin, or Apple stock—and immediately identify which phase the market is in. If you try to use a “trend” strategy while the market is “rotating,” you will likely lose money because the market lacks the momentum to reach your targets. By categorizing the market correctly, you give yourself the best chance of success. This shift from rotation to trend is usually marked by a sudden increase in speed and volume, which we call a “breakout.” Recognizing this shift early allows you to stop looking for reversals and start looking for continuation.
How to Trade a Rotating Market
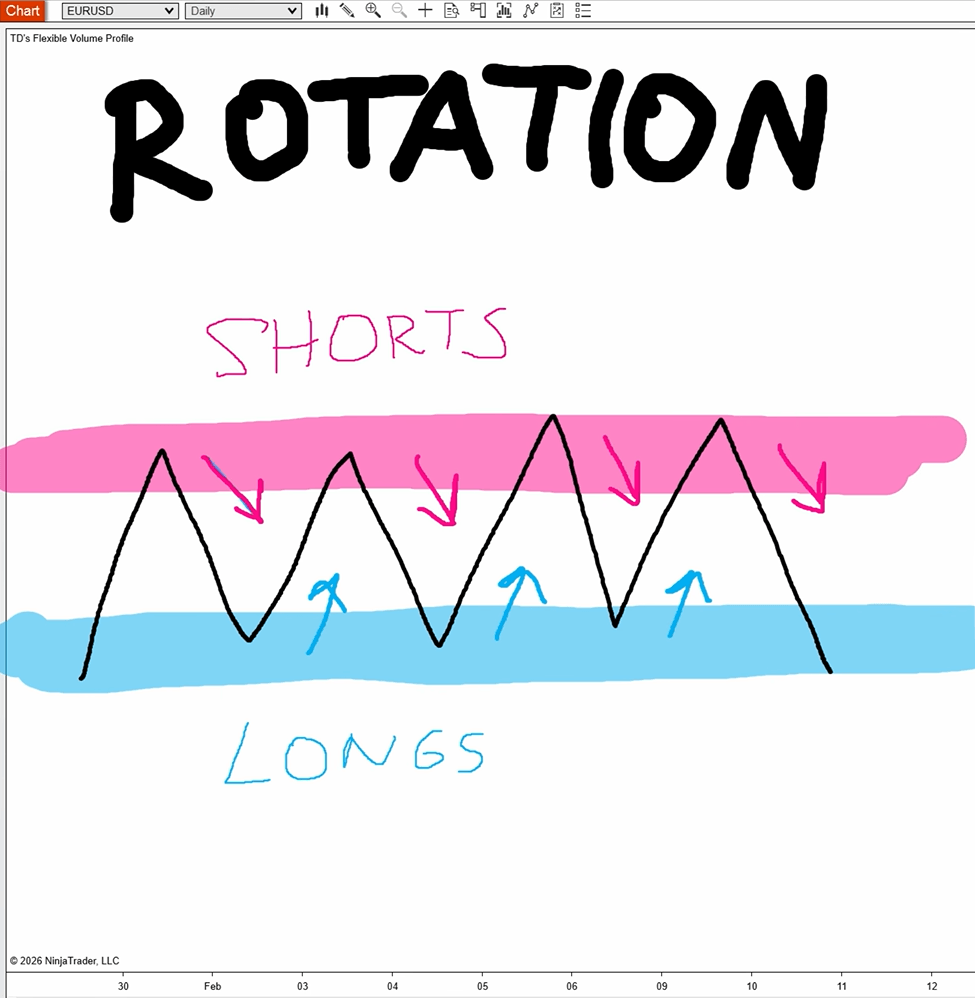
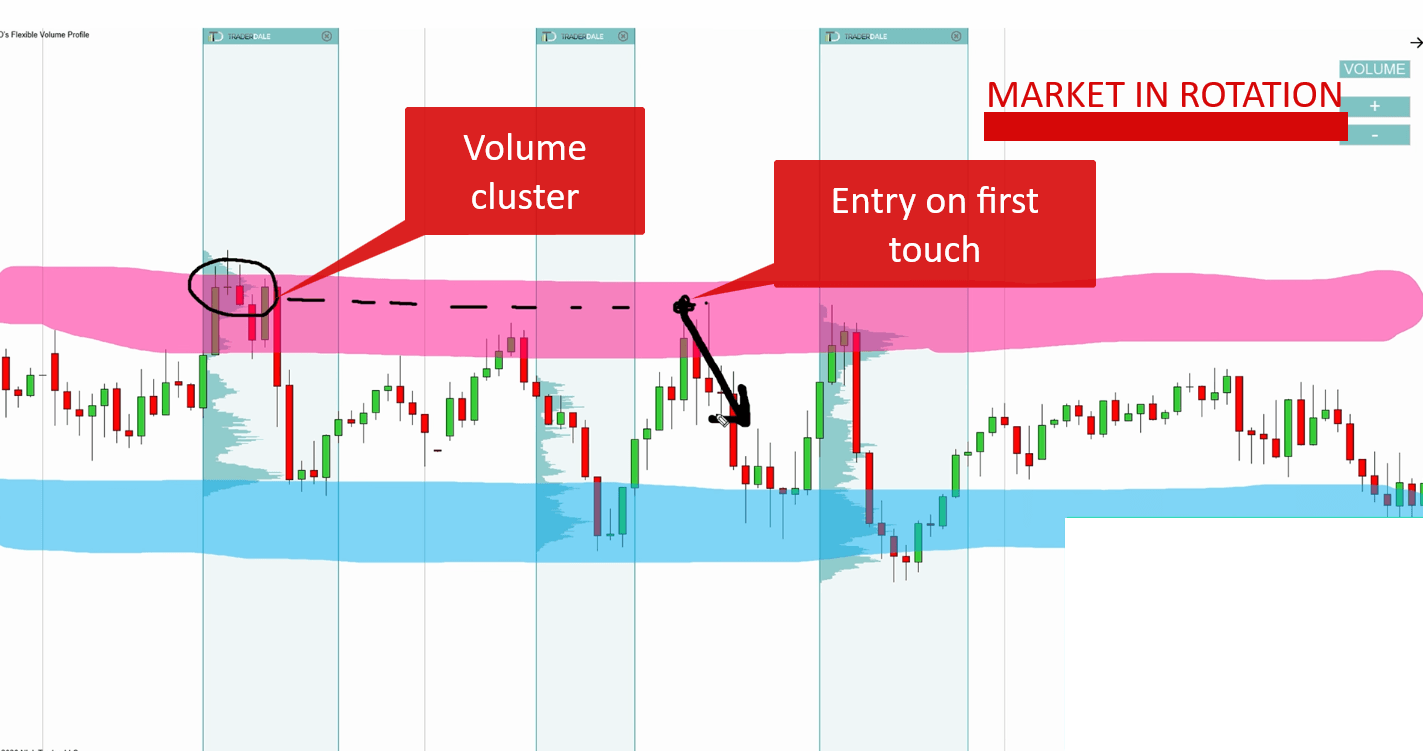
Once you identify that the price is moving sideways, your goal is to “trade the edges.” In a rotation, the price creates a range. Because the market is in balance, it tends to respect the boundaries of that range. When the price reaches the top of the range, it usually runs out of buyers and drops back down. When it hits the bottom, it runs out of sellers and bounces back up. This is the essence of range trading, and it requires a high degree of discipline to avoid the “choppy” middle where no clear advantage exists.
The Logic of "Mean Reversion"
To master how to read any trading chart during a rotation, you should look for “Short” opportunities (betting the price will go down) at the top and “Long” opportunities (betting the price will go up) at the bottom. This is called “Mean Reversion”—the idea that price always wants to return to the middle of the range where everyone agrees the value is fair. Think of the middle of the range as a magnet; the further the price gets from it, the harder the market pulls it back. Professional traders exploit this rubber-band effect to capture quick, high-probability profits at the edges.
Setting Your Boundaries
However, you shouldn’t just click “buy” or “sell” the moment the price touches a line. You want to see evidence that the big players—the banks and institutions—are interested in those levels. We look for areas where the price spent a lot of time and where a lot of trading activity happened. This creates a solid “wall” of orders that is difficult for the market to break through without a significant catalyst.
| Market Phase | Goal | Entry Point |
| Rotation | Mean Reversion | Edges of the range |
| Trend | Momentum | Pullbacks to volume zones |
Managing Risk in a Box
In a rotation, you are essentially betting that the market will stay “stuck.” This is a very high-probability way to trade because, as we mentioned, the market stays in this mode 70% of the time. The danger comes when the rotation ends and a trend begins. That is why we always use stop-losses to protect ourselves if the price suddenly breaks out of the box. A failed rotation is the birth of a new trend, so being stopped out isn’t a failure—it’s a signal that the market environment has changed and it is time to switch your strategy.
The Best Strategy for Trending Markets ( How to trade any charts)
When the market breaks out of a rotation, it enters a trend. This is where the price moves quickly in one direction. Many beginners make the mistake of “chasing” the trend. They see the price going up and they buy at the very top because they are afraid of missing out (FOMO). This is a recipe for disaster because the market eventually has to “breathe” after an aggressive move. Chasing a trend usually means you are entering exactly when the professional players are starting to take their profits, leaving you holding the bag during the inevitable correction.
The Anatomy of a Trend
To understand how to read any trading chart during a trend, you must learn the concept of the “pullback.” Even the strongest trends do not move in a straight line. They move like a staircase: a big move up (impulse), a small move back down (the pullback), and then another big move up. The impulse move is where the big institutions are pushing, and the pullback is where they are taking profits or waiting for more orders. Understanding this rhythm allows you to stay calm when the market moves against you temporarily, knowing it is just a natural part of a healthy trend.

Buying the “Discount”
Your job is to wait for that small move back down. Think of it as a “discount.” If you want to buy a new phone, you’d rather buy it when it’s on sale than when it’s at full price. A pullback is a “sale” in the middle of a trend. You are looking for a specific area where the price is likely to stop dropping and start moving in the direction of the trend again. This “discount” buying is the cornerstone of institutional trading; they never buy at the highs, so neither should you.
Why Pullbacks are Safer
By trading pullbacks, you get a much better entry price and a safer place to put your stop-loss. If you buy during a pullback in an uptrend, your risk is lower because you are entering at a logical “support” level created by the institutions. We never trade against the trend; we wait for the trend to take a breath, and then we jump on board for the next leg of the journey. This approach significantly improves your reward-to-risk ratio, ensuring that your winning trades are much larger than your small, controlled losses.
Tracking the Big Players with Volume Profile
Why does the price bounce at certain levels? It’s not magic; it’s because of the “big players.” Institutions like Goldman Sachs or JP Morgan move 70% of the money in the markets. As retail traders, we are like small fish swimming with sharks. We cannot move the market, but we can follow the sharks and feed where they feed. Understanding their behavior is the key to longevity in this business.
What is Volume Profile?
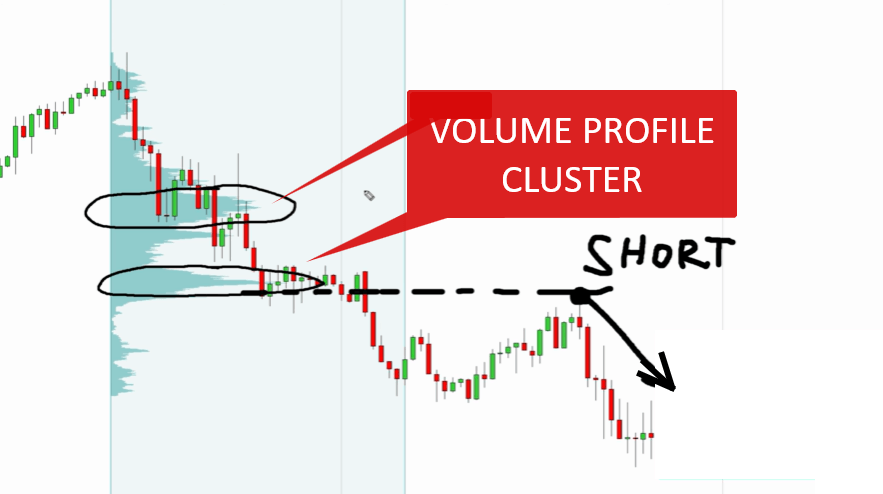
The best tool for this is the Volume Profile. Most charts only show you when the price moved (time) and how much it moved (price). Volume Profile shows you how much trading actually happened at a specific price level. When you see a huge “cluster” or “hump” in the Volume Profile, it means the big players were very active there. This tool removes the guesswork from finding support and resistance by showing you exactly where the most money has changed hands.
Using Clusters as Support and Resistance
When you are learning how to read any trading chart, the Volume Profile acts like a map of institutional activity.
In a rotation, a volume cluster tells you where the banks are accumulating their positions.
In a trend, a volume cluster shows you where the big players entered to push the price higher or lower. These clusters act as psychological and financial anchors for the market. When price returns to a high-volume area, it often stalls or reverses because those who missed the move previously are now eager to enter at the same “fair” price.
Institutional Defense
If the price is in an uptrend and it pulls back to a price level where a massive amount of volume was previously traded, there is a very high chance the big players will defend that level. They don’t want the price to go below their entry point because that would put their massive positions in a loss. They will buy more to protect their interests, causing the price to bounce. This gives you a high-probability entry point based on real data, allowing you to “hide” your orders behind the massive buying power of the banks.
Step-by-Step Practical Example
Let’s put everything together to see how to read any trading chart in a real-world scenario. Mastery comes from repetition and seeing these patterns play out across different markets. Imagine you open your laptop and look at a 30-minute chart of your favorite currency pair.
Step 1: Define the Environment
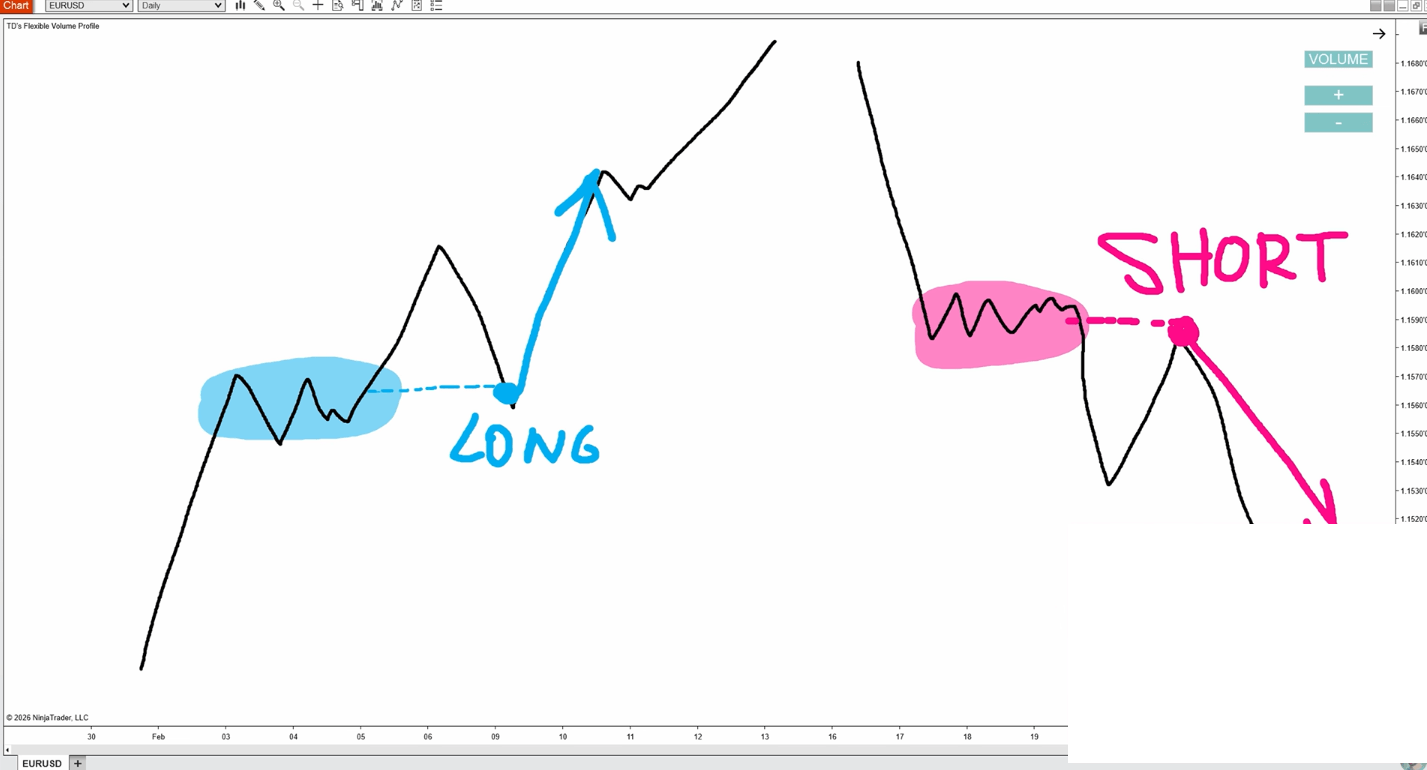
First, look at the last few days of price action. Is it moving in a flat box? Or is it moving diagonally? If it’s a flat box, you are in a rotation. You should pull up your Volume Profile tool and look for the biggest volume clusters at the top and bottom of that box. When the price touches a high-volume area at the top of the box, you look for a Short trade. This is where you exercise extreme patience, waiting for the price to hit the very edge where the risk is lowest.
Step 2: Spotting the Breakout
Now, imagine the price suddenly breaks out of that box and starts moving up rapidly. The rotation is over. You are now in a trend. Don’t panic and don’t buy immediately. Chasing the breakout is how most retail traders get trapped in “fake-outs.” Look at the Volume Profile of the “breakout” move. Find the area where the most volume was traded during that move—this is where the real institutional conviction lies.
Step 3: Executing the Entry
Now, sit on your hands and wait. This is the hardest part for most traders because the fear of missing out is strong. When the price eventually drops back down to that “heavy volume” zone, that is your signal to enter a Long trade. This systematic approach removes the emotion from trading. You aren’t guessing; you are following a set of rules based on market structure and institutional volume. Whether you are trading Forex, Stocks, or Crypto, these rules remain the same because they are based on the core mechanics of how supply and demand work in a professional environment.
Conclusion
Trading doesn’t have to be complicated. By focusing on whether the market is in a rotation or a trend, and using the Volume Profile to see where the big players are active, you can simplify your analysis and make more informed decisions. The goal is to move away from the “noise” of indicators and back to the reality of price and volume. Remember: trade the edges in a rotation, and trade the pullbacks in a trend. Consistency in your approach is what will ultimately lead to consistency in your results.
FAQ: Common Questions About Reading Charts
1. Which timeframe is best for this strategy?
This logic is “fractal,” meaning it works on any timeframe. You can use it on a 1-minute chart for fast trades or a daily chart for long-term investing. Most beginners find the 30-minute or 1-hour chart to be a “sweet spot” for balance and clarity because it filters out the noise of lower timeframes while providing enough trade setups.
2. Does Volume Profile work on all instruments?
Yes, it works on any market where volume data is available, including Forex (using tick volume), Stocks, and Futures. It is especially powerful in markets with high institutional participation because those players are forced to leave large “footprints” in the volume data.
3. What if the price doesn't pull back to the volume zone?
Then there is no trade! One of the biggest lessons in learning how to read any trading chart is that “no trade” is often a winning trade. Don’t chase the market; let the market come to you. Preservation of capital is the first rule of trading, and waiting for the right setup is how you achieve it.
Next steps:
Ready to see these volume levels for yourself? [Click here to download my custom Volume Profile tool] and start following the big players today.
