Do you want ME to help YOU with your trading?
Video Transcript:
Fair value gaps are one of the most popular trading concepts right now. But the truth is, most traders don’t really know how to use them properly. In this video, I’ll show you what actually works and what doesn’t, what makes a good fair value gap, and what makes a bad one. And I’ll show you how to build a solid trading strategy around this.
So, let me kick this off by telling you what the fair value gap represents. When you look at the chart and there’s a fair value gap, it means that one side of the market is more aggressive than the other. In this case, you can see a downtrend, and in this downtrend there are two fair value gaps. This one highlighted in red and this one also highlighted in red. Two fair value gaps telling us that sellers are more aggressive here, pushing the price downwards and creating imbalance. Those are bearish fair value gaps.
On this screen, you can see a bullish fair value gap. It represents buyers—aggressive buyers pushing price upwards. This fair value gap is highlighted in green, and it shows aggressive buyers creating imbalance as they push the price higher and higher. So this is what the fair value gap stands for—the aggression of one side of the market.
Now, technically, a fair value gap is made out of three candles. Here you can see a bullish fair value gap, and here is a bearish fair value gap. Let’s first take a look at the bullish fair value gap. It consists of three candles—one, two, three. In order to have a fair value gap, the high of the first candle should not overlap with the low of the third candle. If those don’t overlap, then you have a fair value gap.
Now let’s take a look at the bearish fair value gap. We have candles one, two, three, and the low of the first candle and the high of the third candle should not overlap. If they don’t overlap, they form a fair value gap. This whole highlighted area is the fair value gap. It doesn’t really matter if the first candle or the third candle is bullish or bearish. The important thing is that gap between the low and the high.
Now, many people trade fair value gaps differently. Let me show you how I trade them and what I consider strong levels in each fair value gap. If you look at the bullish fair value gap, then the strongest level—and the level that I trade from—is the beginning of the fair value gap. This level. The way I trade this is I wait for the pullback, and when the price hits this level—the high of the first candle—I go long from there.
Now let’s take a look at the bearish fair value gap. The beginning of the bearish fair value gap is this level. It is the low of the first candle, and this acts as resistance. When the price makes a pullback to it, I go short from there. For me, those are the strongest levels in every fair value gap.
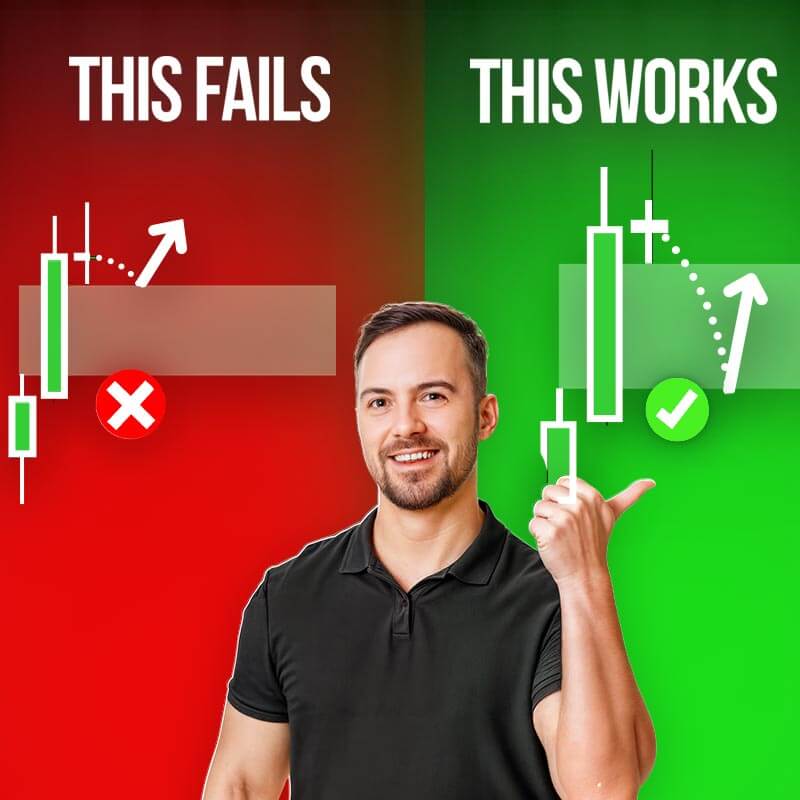
If you look at any chart, you’ll see many fair value gaps. Some of them are strong and good to trade from, and some are not. This is where many people fail, because they just trade all fair value gaps blindly.
So what makes a good fair value gap? Three things: size of the fair value gap, whether the gaps are stacked, and confluences.
Let’s first talk about the size of the fair value gap. The general rule is—the bigger, the better. If you take a look at this picture, you can see a massive candle forming a big fair value gap highlighted in green. This tells you that one side of the market was much more aggressive than the other. In this case, buyers were more aggressive, pushing the price up. Compared to a small fair value gap, this one gives you much clearer information about the market.
Many people ask whether a fair value gap formed during macro news is still good to trade. My answer is yes. I personally like trading fair value gaps formed during macro news events.
The second thing that makes a good fair value gap is stacking. When multiple fair value gaps are close to each other, I treat them as one big fair value gap. The key level is still the beginning of the first one, and that’s where I look for entries.
The last thing is confluence. I like to combine fair value gaps with Volume Profile. When a fair value gap aligns with a significant volume cluster, it becomes much stronger. Volume clusters show where big players were active, and that adds weight to the level.
Now at this point, you’re probably wondering where to get a fair value gap indicator. There are many available online, and most are free. The downside is that some can be buggy. However, I found a decent one on TradingView. When you search for “FVG,” the first indicator works quite well.
There are two important settings. First, “delete boxes after fill”—this removes the fair value gap once it’s fully filled. Second, “extend boxes”—this keeps the level visible until it’s tested.
Now let me show you a few real examples using AUD/USD on the 30-minute chart, which is my preferred timeframe for intraday trading.
You’ll see multiple fair value gaps, but not all of them are worth trading. The strongest ones are those that are large, stacked, and aligned with volume clusters. Those are the ones I focus on.
In some cases, the price doesn’t reach the exact level and reacts before it. When that happens, I consider the level “spent” and I don’t trade it again.
That’s it for this video. Give this strategy a try and see how it works for you. If you want to learn more about Volume Profile trading and the strategies I use daily, visit traderdale.com and check out my courses and tools.
Thanks for watching, and I’ll see you in the next one. Until then, happy trading.