If you have ever entered a trade too late and watched the price reverse right after, you are not alone. Many traders chase price instead of waiting for the right moment to enter. In this article, you will learn how to trade pullbacks with Anchored VWAP, a method that helps you avoid chasing the market and instead wait for a better, safer entry point.
This approach is called the Swing Point VWAP Strategy, and it works especially well in trending markets. Instead of guessing where price might turn, you will learn to identify one key location on the chart, called the swing point, and use it to anchor your VWAP indicator. From there, the indicator shows you a fair price level where big institutions and algorithms tend to place their orders.
By the end of this article, you will understand what Anchored VWAP is, how to find the correct swing point, and how to use pullbacks to enter trades in the same direction as the trend. We will walk through real examples, point out common mistakes, and answer the most common questions traders ask about this strategy.
Table of Contents
5 Quick Takeaways
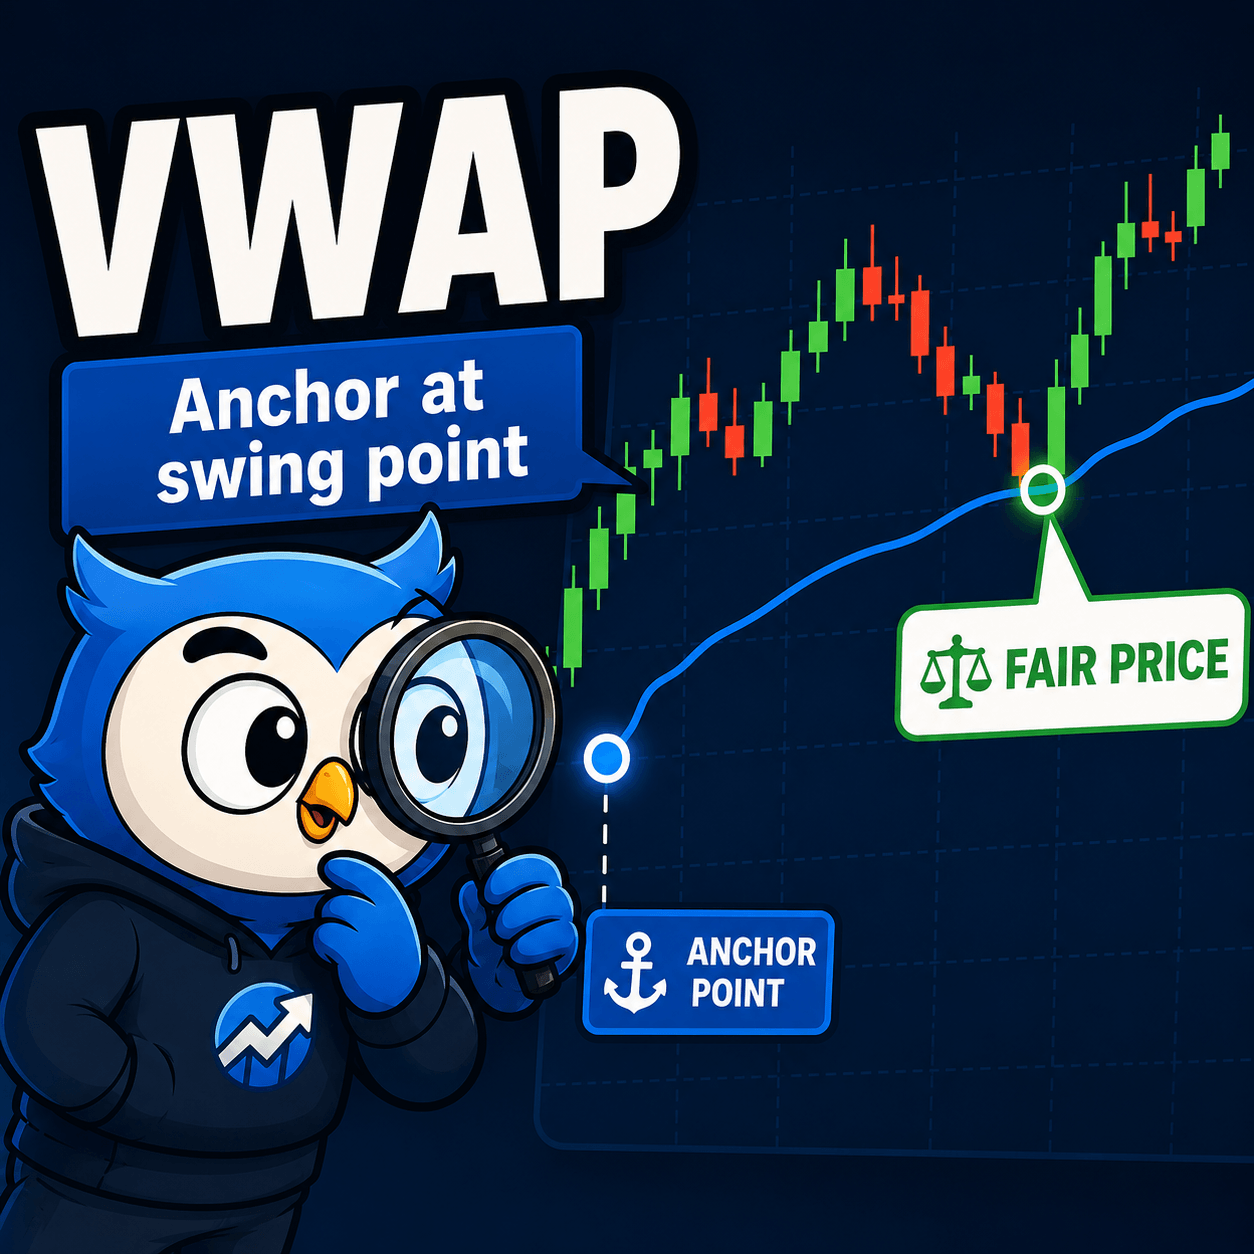
- Anchored VWAP marks the fair price of an asset starting from a specific point in time.
- You anchor the VWAP to the most prominent swing point on the chart, the spot every trader is watching.
- When price returns to touch the VWAP line after moving away from it, that is your pullback entry.
- Sellers use VWAP pullbacks to sell at a fair price in a downtrend, and buyers use them to buy at a fair price in an uptrend.
- This strategy works because big institutions and algorithms use VWAP too, so you are trading alongside them instead of against them.
What Is Anchored VWAP and Why It Matters
Understanding the Basics of VWAP
VWAP stands for Volume Weighted Average Price. In simple terms, it tells you the average price that an asset has traded at, but it gives more importance, or weight, to the price levels where the most volume happened. Regular VWAP usually resets every day, but Anchored VWAP is different. Instead of resetting daily, you choose a specific candle on the chart and the calculation starts from that exact point forward.
Why does this matter for traders? Because Anchored VWAP becomes a moving reference line that represents the fair price since a meaningful event happened on the chart, such as a strong reversal. Once you place the anchor, the VWAP line will follow price as new candles form, showing you, in real time, what the fair average price has been since that important moment.
Why This Indicator Creates Predictable Reactions
This is useful because most market participants, especially big institutions and trading algorithms, also track this fair price. When price moves away from this fair value and then returns to touch it, there is often a reaction. Sellers do not want to sell too cheap, and buyers do not want to buy too expensive. Both sides are watching the same fair price reference, and that creates predictable zones where the market tends to react.
This is the entire foundation of the Swing Point VWAP Strategy. You are not trying to predict the future. You are simply identifying a price level that many large traders already pay attention to, and you are positioning yourself to trade in the same direction they are likely to push the market. That is the core idea behind learning to trade pullbacks with Anchored VWAP, and it is why this method tends to repeat successfully across different charts and markets.
Unlike lagging indicators that only confirm a move after it has already happened, Anchored VWAP gives you a live, evolving reference point. As long as you choose the right anchor, which we will cover in the next section, this tool can give you a clear, repeatable entry method instead of guessing where the next bounce will happen.

How To Find the Right Swing Point
Spotting the Most Obvious Turning Point
The single most important step in this entire strategy is choosing the correct place to anchor your VWAP. If you anchor it in the wrong spot, the fair price level will not mean much to other traders, and the strategy will not work as well.
So what exactly are you looking for? You want to find the most prominent swing point on the chart. This is the spot where, if ten different traders looked at the same chart, all ten would likely point to that exact same candle as the key turning point. It is usually the location where a downtrend turned into an uptrend, or where an uptrend turned into a downtrend.
Think of it this way. If a clear downtrend suddenly stops and a strong uptrend begins, the candle that formed that low is your swing point. That candle represents a moment everyone trading that chart noticed, because it marks a clear shift in market direction. The same logic applies in reverse for a top. If an uptrend stops and a downtrend begins, the candle that formed that high becomes your anchor point.
Avoiding a Weak or Insignificant Anchor
Once you find this candle, you click on it and anchor your VWAP indicator directly to it. From that candle forward, the indicator will calculate the volume weighted average price, and this becomes your fair price reference line going forward.
A common mistake beginners make is anchoring VWAP to a random candle, or to a swing point that is not actually significant. If the swing point is not obvious to most chart watchers, then it will not attract the same level of institutional attention, and the pullback reactions will be weaker or less reliable. Always ask yourself, would most traders looking at this exact chart agree that this is the key turning point? If yes, that is your anchor.
It also helps to zoom out before placing your anchor. Sometimes a swing point looks important on a small time frame but is barely noticeable on a higher time frame. Choosing swing points that are visible and significant across multiple time frames tends to produce stronger and more reliable VWAP reactions later on.

Trading Pullbacks for Short Trades (Example)
Setting Up the Anchor on a Swing High
Let us walk through a real example using a downtrend setup. Imagine you are looking at a chart where price recently formed a clear, prominent swing high. This is the most noticeable high on the chart, the kind of spot every trader watching that instrument would recognize immediately.
You anchor your VWAP to the candle that formed that high. From that point forward, the VWAP line begins tracking the fair price. Since the market is moving downward after that high, price will naturally drift below the VWAP line over time.
Why Sellers Step In at the Fair Price
Now you simply wait. The first time price moves back up and touches the VWAP line, that touch becomes your first short entry opportunity. Why does this work? Because the VWAP represents the fair price since that important high. Sellers do not want to sell the asset too cheaply. They want to sell at a price they consider fair, which is exactly what the VWAP line represents.
This is not just retail traders making this decision. Algorithms and large institutions use Anchored VWAP as one of their primary reference tools. When price reaches that fair value zone, a wave of selling often gets triggered, pushing price back down in the direction of the original trend.
Step | Action |
1 | Identify the prominent swing high |
2 | Anchor VWAP to that candle |
3 | Wait for price to pull back up to the VWAP line |
4 | Enter a short trade at the touch point |
5 | Repeat at each new VWAP touch while the downtrend continues |
How the Pattern Repeats Across the Downtrend
In the original example, this exact pattern repeated multiple times. The first pullback to VWAP offered a short entry. After that move down, price pulled back again, offering a second short entry. This happened a third and even a fourth time, each one following the same simple logic. Every touch of the VWAP line represented another opportunity for sellers to step in at their fair price.
This repeatable nature is what makes the strategy so practical. You are not relying on one lucky trade. You are following a structure that tends to repeat as long as the downtrend remains intact and the anchor point remains relevant.

Trading Pullbacks for Long Trades (Example)
Setting Up the Anchor on a Swing Low
The same logic works in reverse for uptrends, and this is where the strategy becomes especially useful since trending markets often move in this direction for extended periods.
Picture a chart where a downtrend has just ended and a clear uptrend has begun. The candle that formed that low is the most important, most prominent point on the chart. This is your anchor candle. You attach your VWAP here, and from this point forward, the line will track the fair average price as the market climbs.
Since price is now moving upward, it will naturally trade above the VWAP line most of the time. But occasionally, price will pull back down and touch that VWAP line again. Each of these touches represents a long entry opportunity.
Why Buyers Wait for a Fair Entry
Why? Because buyers do not want to pay too much for the asset. They want to buy at a price they see as fair, and that fair price is represented by the VWAP. Institutions and algorithms are not interested in buying at the most expensive point of a rally. Instead, they wait for price to dip back to the average fair value, and that is when buying orders increase.
In the earlier example, this pattern played out clearly. After the initial low, price pulled back to the VWAP and a long trade was triggered. Price moved higher again, pulled back a second time, and another long entry appeared. This repeated a third time as well, each pullback offering essentially the same setup.
Confirming the Pattern With a Second Example
A second example followed the exact same structure. A strong, obvious low formed where a downtrend clearly turned into an uptrend. The VWAP was anchored to that candle, and every subsequent pullback to the line offered another long opportunity, because the big participants moving the market were also buying at that same fair price zone.
The key idea here is simple. You want to align your trades with what large institutions are already doing, rather than trying to fight against their order flow. Trading with the trend, using pullbacks to the fair price, puts you on the same side as the biggest players in the market.

Why Institutions React to the VWAP Level
How Big Players Manage Their Orders
It is worth spending extra time understanding why this strategy actually works, rather than just memorizing the steps. The reason lies in how large institutions and algorithmic trading systems operate.
Big institutions cannot simply buy or sell a large position all at once without significantly moving the price against themselves. Because of this, they often spread their orders out over time, and they use tools like VWAP to judge whether they are getting a good average price compared to the rest of the market.
When the VWAP is anchored to a meaningful swing point, it becomes a shared reference that many traders, both human and automated, are watching at the same time. This shared attention is exactly what creates the reaction you see on the chart. It is not magic. It is simply many participants making similar decisions around the same price level at roughly the same time.
Accumulation, Distribution, and the Importance of the Anchor
In an uptrend, institutions want to accumulate, or buy, at a fair price rather than chasing the market higher. So when price dips back to the VWAP, buy orders increase. In a downtrend, institutions want to distribute, or sell, at a fair price rather than dumping their position into a falling market. So when price rallies back to the VWAP, sell orders increase.
This is also why the strategy tends to fail when the anchor point is poorly chosen. If the swing point is not actually significant, fewer participants are paying attention to that specific VWAP line, so the reaction at that level becomes weaker or disappears entirely. Choosing the right anchor is what gives this entire approach its strength.
Common Mistakes When Trading Anchored VWAP Pullbacks
Choosing the Wrong Anchor and Skipping Confirmation
Even a simple strategy can be misused if a few important details are overlooked. Here are the most common mistakes traders make when trying to trade pullbacks with Anchored VWAP, along with how to avoid them.
The first mistake is anchoring the VWAP to a swing point that is not actually significant. As mentioned earlier, if the high or low you choose is not obvious to most chart watchers, the resulting VWAP line will not carry the same weight, and pullback reactions will be unreliable.
The second mistake is entering a trade the moment price simply touches the VWAP line, without waiting for any confirmation. While the VWAP often does cause a reaction, it is wise to wait for a small additional signal, such as a candle close back in the trend direction, before committing to the trade. This small extra patience can filter out weaker setups.
Ignoring the Trend, Risk, and Re-Anchoring Too Often
The third mistake is ignoring the broader trend. This strategy is built specifically for trending markets. If the market is moving sideways with no clear direction, the swing point itself becomes harder to identify, and pullback reactions tend to be far less reliable.
The fourth mistake is using this method in isolation, without any risk management. Even a strong setup can fail. Always use a stop loss, and always size your position so that one losing trade does not significantly damage your account.
The fifth mistake is switching anchor points too frequently. Once you anchor the VWAP to a meaningful swing point, stick with it until the market structure changes significantly, such as a new, more prominent swing point forming. Constantly re-anchoring removes the consistency that makes this fair price concept useful in the first place.
Conclusion
Learning to trade pullbacks with Anchored VWAP gives you a structured way to enter trends without chasing price. Instead of jumping into a move after it has already happened, you wait patiently for price to return to a fair value zone, the same zone that large institutions and algorithms are watching.
The process is straightforward once you understand it. Find the most prominent swing point on the chart, anchor your VWAP to that exact candle, and then wait for price to pull back and touch the VWAP line. Each touch represents a potential entry in the direction of the trend, whether that means going short in a downtrend or going long in an uptrend.
What makes this approach powerful is not complexity, but alignment. You are simply choosing to trade alongside the same big participants who move the market, rather than guessing against them. Of course, no strategy works every single time, so proper risk management and patience remain essential parts of using this method successfully.
If you take one lesson from this article, let it be this. Stop chasing price, and start waiting for the fair price to come to you.
Frequently Asked Questions
1. What is the difference between Anchored VWAP and regular VWAP?
Regular VWAP usually resets every trading day, while Anchored VWAP starts its calculation from a specific candle that you choose, such as a major swing high or swing low, and continues from there without resetting.
2. Why do institutions react to the VWAP line specifically?
Institutions and algorithms widely use VWAP as a benchmark for a fair average price. Because so many large participants reference the same tool, price often reacts when it reaches that level.
3. Does the Swing Point VWAP Strategy work in sideways markets?
This strategy is designed for trending markets. In sideways or choppy conditions, swing points are harder to identify clearly, and pullback reactions tend to be less reliable.
Final Thoughts
Want to see this strategy applied live on real charts, step by step? Watch the full video walkthrough above, and if you would like a deeper look at how institutions use Anchored VWAP for entries, check out our VWAP course here: