If you have ever wondered where to anchor VWAP for the best results in intraday trading, you are not alone. Many traders place VWAP randomly on their charts and wonder why it does not seem to work. The truth is simple. Anchored VWAP intraday trading only becomes powerful when you choose the right starting point, and one of the most reliable starting points is the beginning of the trading week. In this article, I draw on my experience teaching Volume Profile and Order Flow concepts to traders around the world, and I will show you exactly why the start of the week matters so much. You will learn what VWAP really represents, how to use it as support and resistance, and how to spot the difference between a trending market where this setup shines and a sideways market where it does not work as well. By the end, you will understand how institutions, algorithms, and experienced traders all use this same fair price level to time their entries.
Table of Contents
5 Quick Takeaways
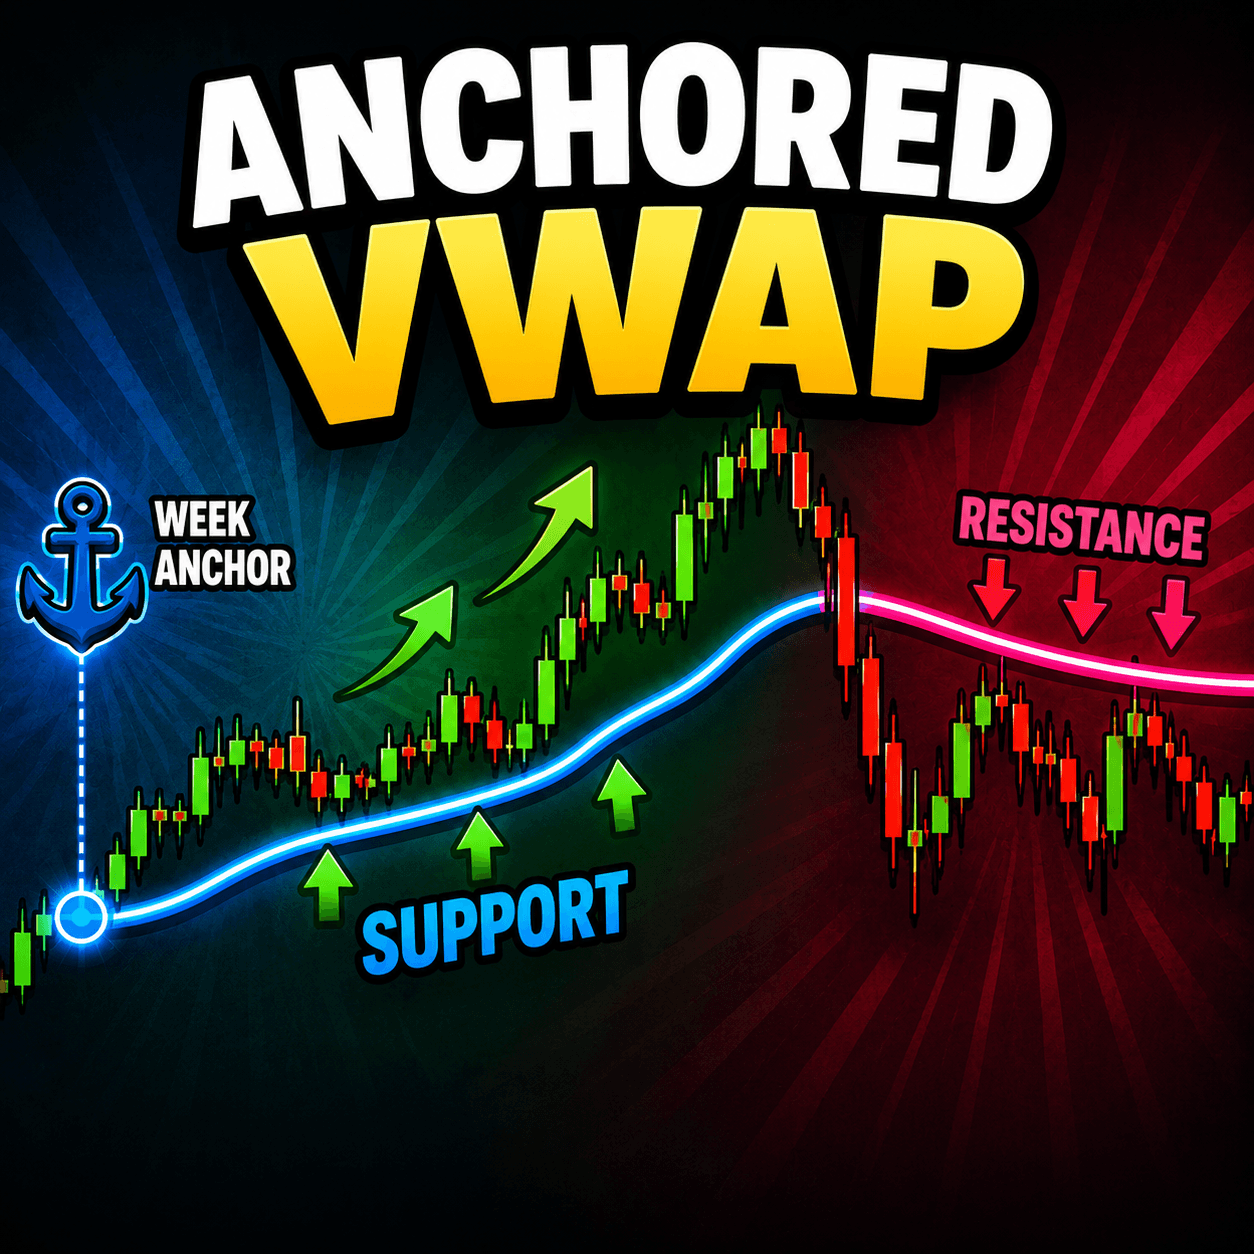
- Anchor your VWAP to the first candle of the trading week for a fair price level that matters to most traders and algorithms.
- The VWAP line shows the average price paid by an average trader since that anchor point.
- When price pulls back to VWAP from above, it often signals a short When it pulls back from below, it often signals a long opportunity.
- Once price closes below VWAP, the line can flip from support into resistance, and vice versa.
- This setup performs best in trending markets and is less reliable in sideways, choppy conditions.
What Is Anchored VWAP and Why the Start of the Week Matters
VWAP stands for Volume Weighted Average Price. Instead of just looking at where price closed, VWAP factors in how much volume traded at each price level. This gives you a much more honest picture of where the real action happened. But here is the part many traders miss. VWAP is only useful if you anchor it to a point in time that actually matters to the market.
Think about it this way. If you anchor VWAP to a random Tuesday afternoon, very few traders are paying attention to that specific moment. But if you anchor it to the start of the trading week, something different happens. Almost every intraday trader, every algorithm, and every institutional desk is watching how price behaves relative to where the week began. This is one of the most universally respected reference points in the market. The start of the week is important to as many participants as possible, which is exactly why it makes such a strong anchor.

Once anchored, the VWAP line becomes a moving average of sorts, but a much smarter one. It is not just averaging price. It is averaging price weighted by volume, since the start of the week. This means the line represents what most traders, on average, actually paid to get into their positions during that period. That single fact is the foundation of everything else in this strategy.
In the video example, the chart used was a 30-minute timeframe, which works well for intraday traders who want a few solid setups per week without watching every single candle. You do not need a faster or slower timeframe to use this concept. The 30-minute chart strikes a good balance between catching enough setups and avoiding too much noise.
Understanding the Fair Price Concept
Here is where this strategy becomes genuinely useful instead of just another line on your chart. The VWAP line represents what we can call the fair price. This is the price that an average trader, weighted by how much volume they traded, has been willing to pay since the start of the week.
Why does this matter so much? Because sellers want to sell at a fair price, and buyers want to buy at a fair price. Nobody wants to feel like they got a bad deal. Experienced traders, the ones who consistently make money, are patient. They do not chase price far away from fair value. Instead, they wait.

Picture a downward-trending market with prices making lower highs and lows. An inexperienced trader might sell at any point, even below the VWAP fair price. A disciplined trader waits, knowing the price will eventually rebound to the VWAP line, which signals a good sell point, not driven by fear or randomness, but by math.
The same applies to buyers: in an uptrend, they avoid chasing prices higher and seek to buy near fair value. When the price pulls back to VWAP during an uptrend, it’s a buying opportunity. This strategy isn’t about predicting but about recognizing that most traders behave similarly around a shared reference point, making the chart more understandable.
Using VWAP as Support: A Long Trade Example
Let us walk through what this looks like in a real long trade scenario. After anchoring VWAP to the first candle of the week, you simply watch how price behaves around that line.
In an uptrend, you will often notice price making small reactions near the VWAP line. These are not dramatic crashes through the line. They are gentle touches, small dips that quickly bounce back up. Each one of these touches is a potential signal to consider going long.

It is worth repeating that you do not need to trade this in isolation. This setup works well as a confirmation tool alongside your existing strategy. If you already use price action, Volume Profile, or Order Flow concepts to find levels, anchored VWAP can add another layer of confidence. When your existing level lines up with the VWAP support, that confluence often strengthens the trade idea. On the other hand, if you prefer a simpler approach, this setup can absolutely be traded as a standalone method too.
The key here is patience. You are not chasing every small wiggle in price. You are waiting for price to come back to that fair value line, and then watching for a reaction. A reaction means price touches the line and then moves away from it again in the direction of the trend. That reaction is your confirmation.
Using VWAP as Resistance: When Support Flips
Markets do not move in one direction forever, and this is where understanding the flip from support to resistance becomes essential. At some point, price may break below the VWAP line and start trading underneath it. When that happens, something important shifts.
Remember, the VWAP line represents the fair price. So once price moves below that fair price, the people who wanted to sell at a fair price now see the VWAP as the level where they get their best opportunity to sell, since price is currently trading below it. In other words, the VWAP line has now become resistance.
This is a concept that trips up a lot of traders early on, so let us slow down and break it apart. Before the flip, when price was above VWAP, pullbacks down to the line were buying opportunities, because buyers saw that level as fair value support. After price closes below VWAP, the psychology shifts. Now sellers see any rally back up to that same line as their fair value resistance, because price is currently trading at a discount relative to where it has been.
So the rule becomes straightforward. Support becomes resistance, and resistance becomes support, depending on which side of the VWAP line price is currently trading. If price later climbs back above the VWAP line again, the whole cycle resets, and VWAP becomes support once more. This constant flipping is not a flaw in the strategy. It is actually the strategy working exactly as intended, reflecting the real shift in who is in control, buyers or sellers.

Why This Setup Works Best in Trending Markets
This is one of the most important points in the entire strategy, and it deserves its own clear explanation. The Anchored VWAP setup described above works best when the market is in a trending condition, whether that trend is moving upward or downward in a clear, sustained way.
Market Condition | How Anchored VWAP Performs |
Strong uptrend | Excellent, clean pullback entries to VWAP support |
Strong downtrend | Excellent, clean pullback entries to VWAP resistance |
Sideways or choppy market | Unreliable, frequent false signals |
Why does this happen? In a trending market, there is a clear directional bias. Most participants generally agree on the broader direction, even if they disagree on the exact timing of their entries. This agreement creates the clean, repeated pullback behavior around the VWAP line that we have been discussing throughout this article.
In a sideways market, that directional agreement disappears. Price chops back and forth without committing to a clear path, which means touches of the VWAP line do not carry the same significance. You might get a bounce in one direction, only to see price reverse shortly after, leading to false signals and frustrating losing trades. This does not mean VWAP becomes useless in sideways conditions. It simply means the clean, repeatable pullback setup described in this article loses much of its reliability.
The practical takeaway is simple. Before relying heavily on this setup, take a moment to assess the broader market structure. Ask yourself whether the market is genuinely trending or simply drifting sideways. This one extra step can save you from a number of unnecessary losing trades.
Conclusion
Anchoring VWAP to the start of the trading week gives you a fair price reference point that matters to a huge number of market participants, from retail traders to algorithms to institutional desks. Once anchored, this line shows you where the average trader has been buying and selling, and it allows you to spot clean pullback opportunities in both long and short directions. We covered how support can flip into resistance and back again depending on which side of the VWAP price is trading. Most importantly, remember that this setup shines brightest in trending markets and becomes far less reliable when price moves sideways. Whether you use this as your main strategy or simply as a confirmation tool alongside your existing approach, understanding the fair price concept behind VWAP can add real clarity to your intraday decision making. Practice spotting these setups on historical charts before applying them with real money, and always combine this knowledge with sound risk management.
FAQ
1. Why should I anchor VWAP to the start of the week instead of the start of the day?
Anchoring to the start of the week creates a reference point that a much larger number of traders and institutions are watching, which tends to produce more meaningful reactions at the VWAP line compared to a daily anchor.
2. Can anchored VWAP be used on timeframes other than 30 minutes?
Yes. While the 30-minute chart works well for many intraday traders, the same fair price concept applies on other intraday timeframes, though you may need to adjust your expectations for how often setups appear.
3. Does anchored VWAP work well in sideways markets?
Generally, no. This setup is most reliable in trending markets. In sideways conditions, price often gives false signals around the VWAP line, so it is best used alongside other confirmation tools during choppy periods.
.
Final Thoutghts
Want to see this Anchored VWAP setup applied live on real charts with Order Flow and Volume Profile context? Check out our courses on Volume Profile, VWAP, and Orderflow, which cover Trend Setups to deepen your understanding of fair price trading.