I'm back with another episode of the Trade of the Week series.
In today's Episode 27, I break down a NZD/USD swing trade where the biggest lesson isn't the entry...
It's the exit.
More specifically, why I planned two different take-profit levels, and how I decided which one to use.
Here’s what you’ll learn:
✅ How I identified the swing entry using Volume Profile
✅ Why the Fair Value Gap added extra confirmation
✅ My rule for placing stop-losses on swing trades
✅ Why I planned two different take-profit targets
✅ How market structure helped me lock in profits
Watch the video here:
www.trader-dale.com/trade-of-the-week-nzd-usd-swing-trade-with-two-take-profits-3rd-jul-26/
P.S. In honor of Independence Day, we are offering special 55% discount on my best trading tools and education.
This offer is only available till 10th of this month, so if you've been waiting for the right time to upgrade your trading, this is it.
Here is what you can get:
🎯Volume Profile Pack
15+ Hour video course
Daily/Swing trading signals
Volume Profile indicators
VWAP indicator
FREE Tech call & Indicator setup
👑Order Flow Pack:
12+ Hour video course
Order Flow software
Volume Profile software
FREE Tech call & Indicator setup
🚀VWAP Pack
9+ Hour video course
VWAP software
Volume Profile software
FREE Tech call & Indicator setup
💡Smart Money Pack
6+ Hour video course
Smart Money Software
12+ Hours of Live Trading Videos
FREE Tech call & Indicator setup
Get all four packs together and get -55% discount
Get it here:
www.trader-dale.com/volume-profile-forex-trading-course/
OUR IRONCLAD 🛡️MONEY-BACK GUARANTEE:
What makes this sale even better? An ironclad, risk-free money-back guarantee.
You can try everything for two full weeks, if you’re not satisfied for any reason, you get a full refund, no questions asked.
... See MoreSee Less
3 days ago
In honor of Independence Day, I’m offering a special 55% discount on my best trading tools and education.
If you’ve been waiting for the perfect moment to level up your trading game, now’s the time!
Here is what you can get:
🎯Volume Profile Pack
15+ Hour video course
Daily/Swing trading signals
Volume Profile indicators
VWAP indicator
FREE Tech call & Indicator setup
👑Order Flow Pack:
12+ Hour video course
Order Flow software
Volume Profile software
FREE Tech call & Indicator setup
🚀VWAP Pack
9+ Hour video course
VWAP software
Volume Profile software
FREE Tech call & Indicator setup
💡Smart Money Pack
6+ Hour video course
Smart Money Software
12+ Hours of Live Trading Videos
FREE Tech call & Indicator setup
Get all four packs together and get -55% discount
Get it here:
www.trader-dale.com/volume-profile-forex-trading-course/
🛡️OUR IRONCLAD MONEY-BACK GUARANTEE:
What makes this sale even better? An ironclad, risk-free money-back guarantee.
You can try everything for two full weeks & if you’re not satisfied for any reason, you get a full refund, no questions asked!
... See MoreSee Less
4 days ago


Thanks Dale, your articles are really useful and educational.
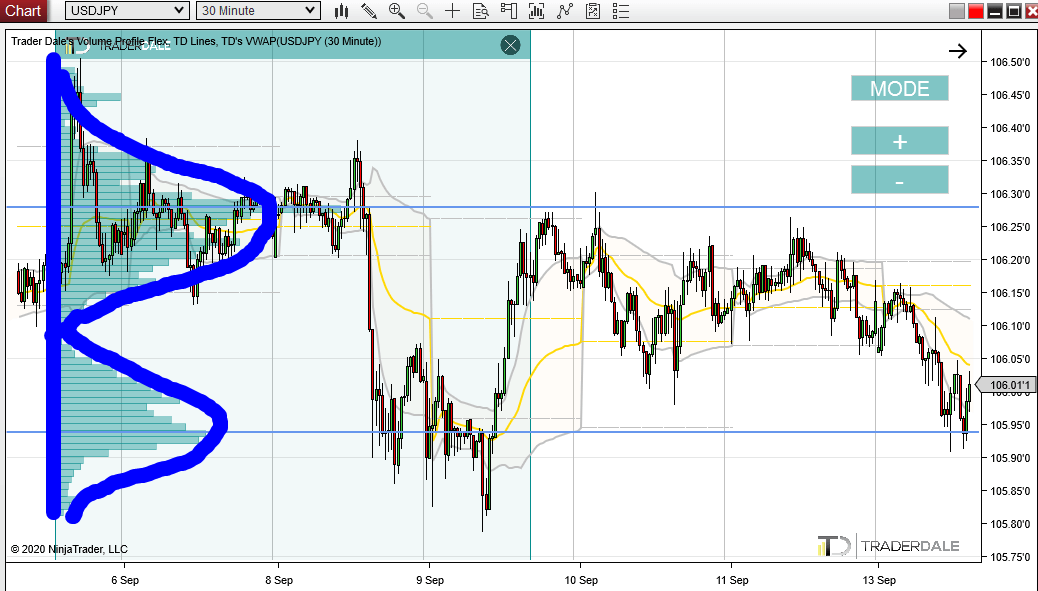
Very informative, it also teaches me to expect strong future volume accumulation activity in the center while I do not have the Flexible volume tool to monitor it.
Never heard and read anything like this! Very informative and eye-opening. Thanks, Trader Dale
My trading career is going to another level. Thank you Dale!!
Joined recently, but WOW enjoying everything, course and indicators.
GREAT WORK DALE!!!!!
Thank you Dale so much, nicely and clearly explained 🙂
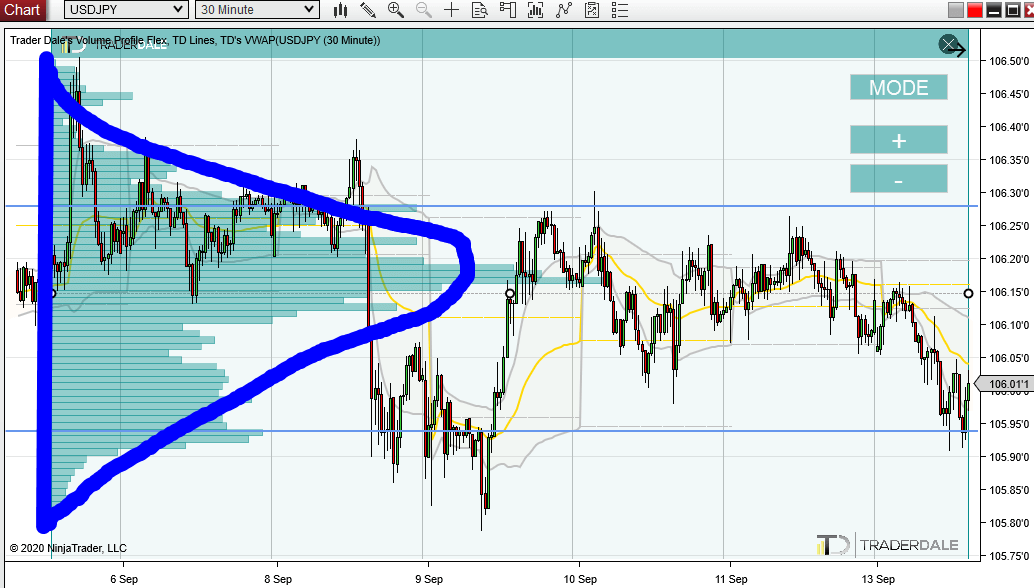
Dale, I understand the transformation to D-shaped profile like akumulation and competition of both sides, and finely price explodes to one direction. Do I understand it right? Thanks once more