Mastering the art of institutional trading requires more than just following basic indicators; it requires understanding how big banks move the markets. One of the most effective ways to do this is by learning how to trade using support and resistance flips with volume profile. This strategy bridges the gap between historical price action and real-time liquidity data, allowing you to enter trades with surgical precision. In this comprehensive guide, we will break down the mechanics of “flips,” identify high-interest volume clusters, and show you how to combine these elements into a high-probability trading system used by professionals.
Table of Contents
The Power of Confluence in Trading
When you first start trading, it is incredibly easy to get overwhelmed by the hundreds of technical indicators available at your fingertips. You might try to layer RSI, MACD, Bollinger Bands, and multiple moving averages all at once, only to find that they frequently give you conflicting signals—one says buy while the other says sell. In my decade of analyzing charts professionally, I have found that the most successful traders do not actually use more indicators; they use confluence.
The Concept of Confluence
Confluence is essentially a fancy word for “agreement” or “alignment.” It happens when two or more independent trading styles, tools, or philosophies point to the exact same price level simultaneously. Imagine you are building a house. If you use only one pillar to support the structure, the roof might be shaky and prone to collapse under pressure. If you use three pillars placed strategically, the roof becomes solid and dependable. Trading works on the same principle. We are looking for price levels where different “pillars” of technical analysis agree that a reversal or bounce is likely.
Identifying High-Interest Zones
In this comprehensive guide, we specifically focus on the powerful agreement between Price Action (the historical record of how price moved) and Volume Profile (the record of how many shares, lots, or contracts were bought and sold at specific price points). When we find a support and resistance flip that happens at the same price as a heavy volume cluster, we have identified a “High-Interest Zone.” This is where the “smart money”—the big banks, hedge funds, and major institutions—is likely to defend their positions.
Moving from Guesswork to Precision
By focusing strictly on confluence, you stop the exhausting habit of guessing. You stop taking every random bounce or “hunch” on the chart and start waiting for the “perfect” trades that meet all your criteria. This disciplined patience is the primary factor that separates a hobbyist from a professional. We aren’t looking to trade 100 times a day and get chopped up by market noise; we are looking to trade only when the mathematical and psychological odds are stacked heavily in our favor.
Understanding the Support and Resistance Flip
The support and resistance flip is one of the oldest, most foundational, and most reliable concepts in the world of price action trading. To truly master it, you have to look past the lines on the screen and think about the human psychology and institutional order flow driving the market.
What is Resistance?

Resistance is best visualized as a “ceiling.” It represents a price level where the supply of sellers is significantly stronger than the demand from buyers. Every time the price climbs to hit that ceiling, it is swatted back down. Traders watching the chart see this repeated failure and think, “Okay, the market has decided this price is too high; I should enter a sell order here.” This creates a self-fulfilling prophecy where more sell orders pile up at that specific level.
What is Support?

Support is the opposite: it is a “floor.” It is a price level where buyers are much stronger than sellers. When the price falls to this floor, it finds a “safety net” and bounces back up. Traders observe this and think, “This is a bargain; the price is undervalued here.” As the price approaches this floor, a wave of buying pressure enters the market, preventing the price from falling further.
The Flip: How to Trade Using Support and Resistance Flips
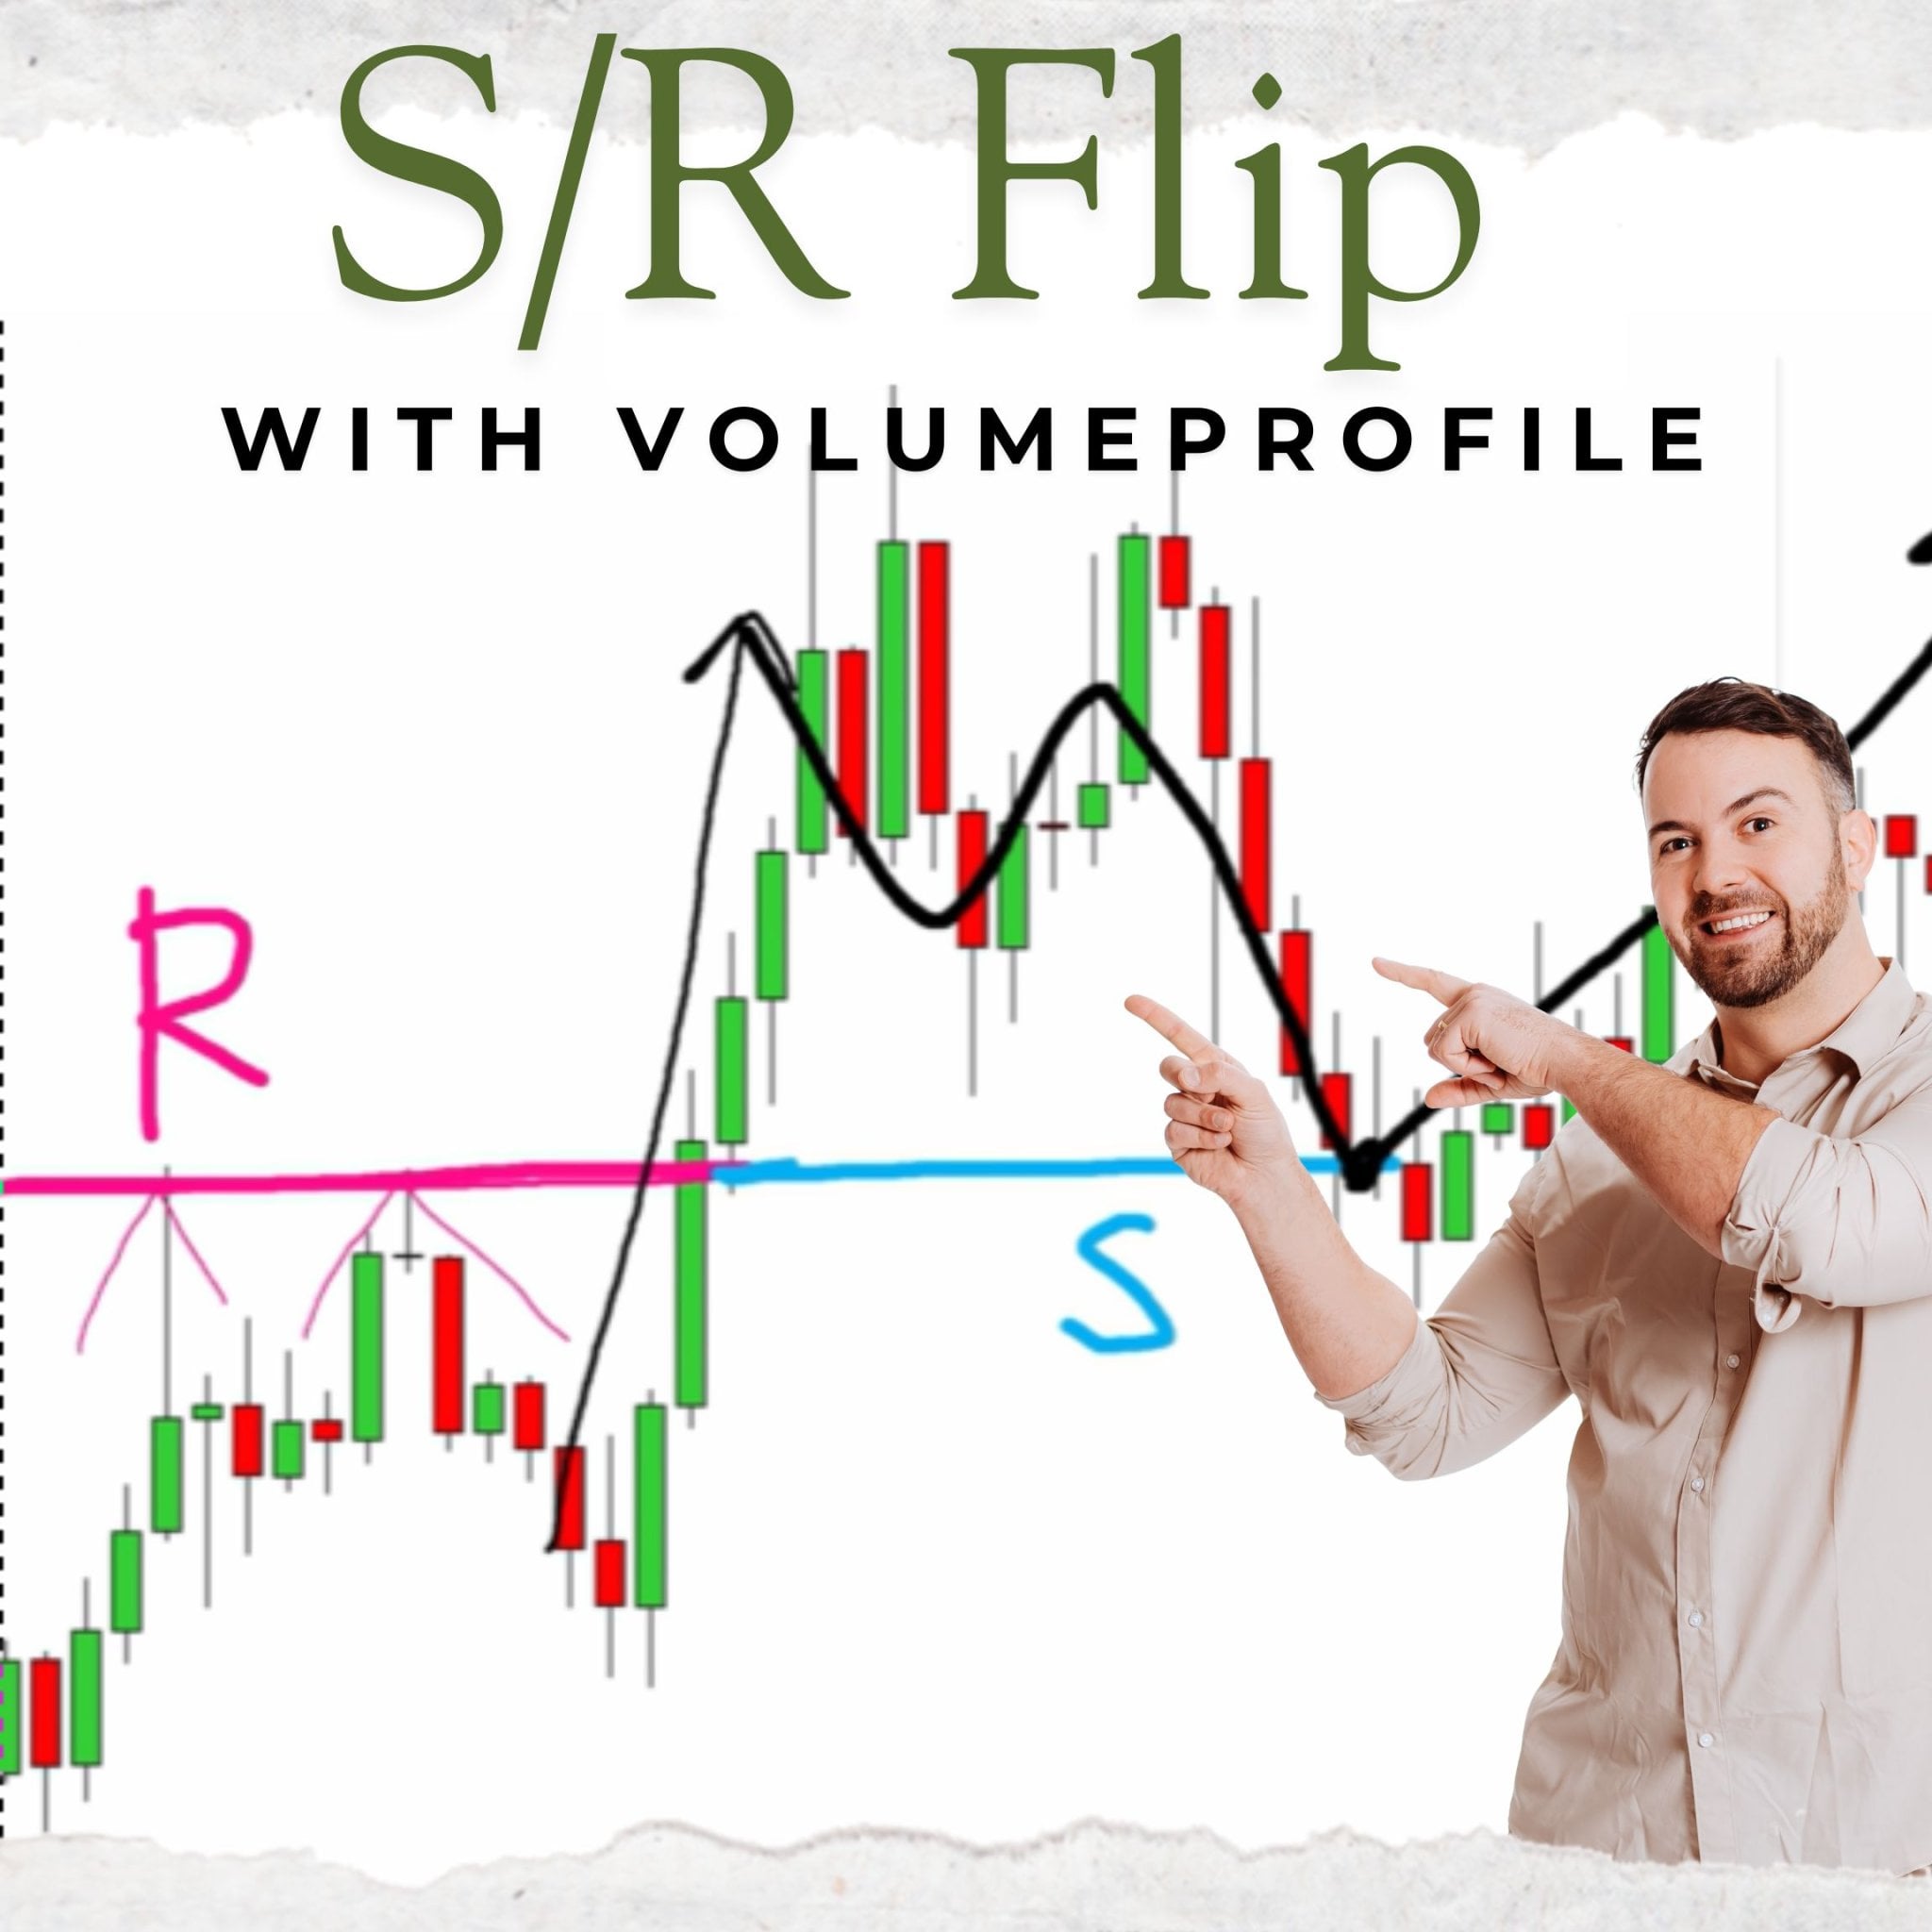
The real magic happens when the price finally accumulates enough momentum to break through one of these established levels. If the price breaks above a resistance (the ceiling), that level doesn’t just vanish into thin air. Instead, it “flips” roles and becomes a new support (a floor).
Why does this happen? It’s driven by regret and repositioning. The traders who sold at that resistance now realize they were on the wrong side of the market. When the price eventually dips back down to that level (the retest), those trapped sellers “buy to cover” their losing positions to get out at break-even. Simultaneously, new buyers who missed the initial breakout jump in because they see a second chance to enter at a “proven” level.

Using Volume Profile to Find Heavy Interest
While standard price action tells us where the price went, the Volume Profile tells us exactly how much “business” was done at those specific prices. This distinction is the “secret sauce” that allows retail traders to see the footprints of institutional trading.
Most novice traders use standard volume bars located at the bottom of their charts. These vertical bars tell you how much volume happened during a specific unit of time (like a 5-minute or 1-hour candle). However, big banks don’t just care about time; they care about price. Volume Profile displays a horizontal histogram on the side of your chart. The longer the horizontal bars, the more trading activity and liquidity were present at that specific price level over a selected period.
The Volume Cluster: How to Trade Using Support and Resistance Flips with Volume Profile
In this strategy, we are specifically hunting for Volume Clusters. A cluster is a prominent “belly” or a “bump” in the profile where the bars are significantly longer than the ones immediately above or below it. These clusters represent high-volume nodes where big institutions—the likes of Goldman Sachs, JP Morgan, or major central banks—were filling massive orders over days or weeks.
When you see a large volume cluster, you are looking at a historical “battlefield.” A massive amount of money changed hands there as buyers and sellers fought for control. If the price later moves away from that cluster in a strong, aggressive trend, it provides a clear signal: one side won the battle decisively.
The reason these clusters are so vital for our entry is that when the price eventually returns to that level (a “pullback”), those same big players will often step in to defend their zone. These institutions have “skin in the game” and often have remaining orders to fill or a vested interest in not letting the price move past the level where they spent millions of dollars building their original positions.
Step-by-Step: The Trend Setup Strategy
Now, let’s synthesize these powerful ideas into a repeatable, objective strategy. We call this the Trend Setup. The goal is not to catch a falling knife or guess a market top, but to find a market that is clearly moving in one direction and wait for a very specific type of “correction” or “pullback” into a zone of high confluence.
The Checklist for a Long Trade (Buying)
Identify a Clear Trend: Look for a market characterized by a series of higher highs and higher lows. You want to see “bullish intent” where the buyers are clearly in control.
Locate the Volume Cluster: Use your Volume Profile tool (Fixed Range is best) to highlight the recent trending move. Identify where the most trading activity occurred during that specific advance.
Check for an S/R Flip: Look to the left of your chart. Was this high-volume area also a previous “ceiling” or resistance level that the price struggled to break earlier? If yes, you have found your “pillar” of price action.
Wait for the Pullback: This is the hardest part for many. Do not chase the price as it’s moving away. Have the discipline to wait for the market to fall back down to the exact level where the volume cluster and the S/R flip align.
Execution: Once the price enters this “confluence zone,” you look for your entry. This is your high-probability strike zone.

Mastering the Trend Setup: How to Trade Using Support and Resistance Flips
By following this rigorous checklist, you aren’t just buying because the price looks “cheap” or “oversold.” You are entering a trade because:
The Trend is Your Friend: You are aligned with the overall market momentum.
Volume Profile Proof: You have statistical evidence that institutions are positioned at this price.
Price Action Confirmation: The S/R Flip adds a layer of psychological support that other technical traders are also watching.
| Feature | Why it Matters |
| Trend | Ensures you are moving with the market’s primary momentum. |
| Volume Cluster | Proves that institutions have “skin in the game” at this specific price. |
| S/R Flip | Adds a psychological layer of support from retail and technical traders. |
The Bonus Edge: Fair Value Gaps (FVG)
If you are looking to truly optimize your entries and achieve an even higher win rate, you can add a third layer of confluence to your toolkit: the Fair Value Gap (FVG). This is a core concept from “Smart Money Concepts” (SMC), and it fits perfectly with our Volume Profile and S/R Flip strategy because it identifies market urgency.
Identifying Imbalances: How to Trade Using Support and Resistance Flips with FVG
A Fair Value Gap occurs when the market moves so rapidly in one direction that it creates a “hole” or a temporary liquidity imbalance. In a standard candlestick chart, this appears as a sequence of three candles where there is a large, energetic middle candle. The “wicks” of the first candle and the third candle do not overlap, leaving a literal gap in the price action where only one side (e.g., only buyers) was able to participate.
Combining Imbalances and Flips

Often, the “origin” or the beginning of a Fair Value Gap aligns perfectly with our Volume Cluster and our Support/Resistance flip. When you find a price level where all three elements exist, you have discovered what I call a “Perfect Trade.”
Volume Cluster: Shows where the institutional position was built.
S/R Flip: Shows the historical price floor or ceiling.
Fair Value Gap: Shows the market imbalance and the “urgency” of the move away from that level.
When these three factors align, the reaction is often very sharp, very fast, and incredibly precise. It’s as if the price hits a brick wall and bounces instantly. However, a crucial word of caution: if the price begins to turn around just before reaching your level (missing it by a few pips), the “resting orders” at that level might have already been satisfied by the nearby liquidity. In that case, the level is “used up.” We always prioritize the “first touch” of the level for the highest probability of success.
Conclusion and FAQ
Trading does not have to be a confusing guessing game or a gamble. By integrating the support and resistance flip with the data-driven insights of the Volume Profile, you are no longer looking at random lines; you are looking at the market through the lens of supply, demand, and institutional intent. You are effectively following the “footprints” left behind by the world’s largest banks.
The ultimate key to success with this strategy is unwavering patience. On any given day, you might see five or six different volume clusters on a chart, but you must have the discipline to ignore the ones that lack confluence. Only trade the setups where the volume data and the price history tell the same story. This filtered, high-conviction approach will help you avoid “fake-outs” and ensure you stay on the right side of the prevailing trend.
Frequently Asked Questions
1. What timeframe is best for this strategy?
This setup is fractal, which means the logic holds true on any timeframe from a 1-minute chart to a Monthly chart. However, for most traders, I recommend the 30-minute or 1-hour charts for day trading, as they provide a good balance of frequency and reliability. For swing trading, the Daily chart is king. Remember: the higher the timeframe, the more “weight” the volume cluster carries.
2. Do I need expensive, specialized software for Volume Profile?
Absolutely not. Most modern, high-quality charting platforms like TradingView, Sierra Chart, or NinjaTrader include Volume Profile indicators. On TradingView, you are specifically looking for the “Fixed Range Volume Profile” (to measure specific moves) or the “Visible Range Volume Profile” (to see the whole screen’s activity).
3. What if the price just goes straight through my level?
No trading strategy in existence wins 100% of the time. This is why you must always use a Stop Loss. A general rule of thumb is to place your stop loss on the “clean” side of the volume cluster. If the price moves entirely through the high-volume node, it proves that the big players are no longer interested in defending that zone, the “story” of the trade has changed, and you should exit the position immediately.
Next Steps
Ready to master these institutional setups? Visit trader-dale.com and click on “Trading Course & Tools” to get access to my custom-coded indicators, proprietary tools, and deep-dive video training modules. Stop guessing and start trading alongside the big banks today!