In this comprehensive guide, I draw on my decades of experience as a professional trader and market analyst to show you exactly how to improve price action trading with Volume Profile. Most retail traders fail in the long run because they only see the surface level of the market—the colorful candlesticks on their screens. You are about to learn how to peel back the curtain and identify precisely where big institutions, such as central banks and multi-billion dollar hedge funds, are moving massive amounts of capital. By the end of this article, you will stop guessing where the market might go based on “gut feeling” and start trading with institutional clarity. By combining simple, reliable chart patterns with raw institutional volume data, you can significantly increase your win rate, optimize your risk-to-reward ratio, and finally achieve Profitability.
Summary of the Article
The Missing Link: Pure price action shows what happened in the past; Volume Profile shows why it happened by revealing real-time institutional activity and capital commitment.
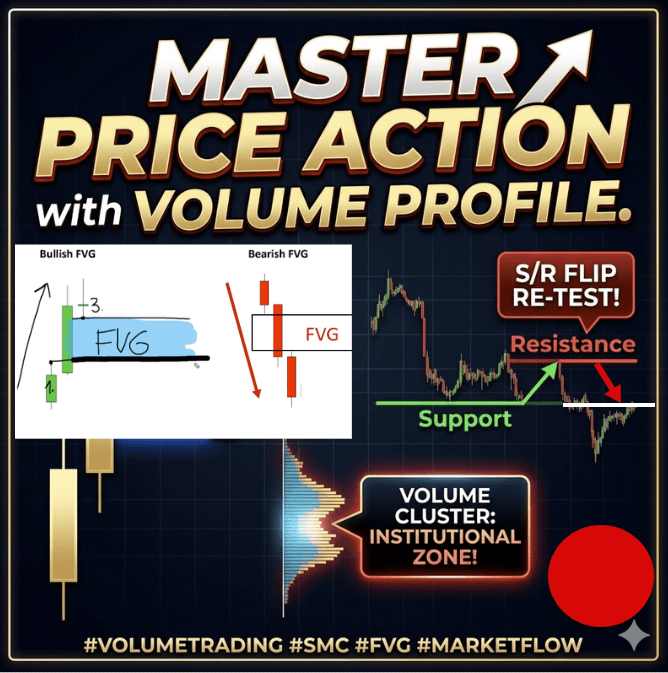
Fair Value Gaps (FVG): These specific three-candle formations signal market imbalances and aggressive buying or selling pressure from the most powerful players.
The Power of Clusters: A Fair Value Gap becomes a high-probability trade when it aligns perfectly with a heavy volume cluster, also known as a High Volume Node or Point of Control.
S/R Flips: Broken support levels become resistance (and vice versa), especially when confirmed by high trading volumes at the “flip” zone, creating a “trapped trader” effect.
Institutional Defense: Big players protect the specific price levels where they accumulated their positions to keep their average entry in the green, creating “walls” that the price struggles to break.
Table of Contents
1. The Secret to Consistent Trading: Beyond Clean Charts
When I first started my journey in the global financial markets, I made a classic mistake that almost every beginner makes: I overloaded my screens with every tool available in the indicator library. I had RSI, MACD, Stochastics, and multiple Bollinger Bands all competing for space. My charts looked like a cluttered, flashing Christmas tree, and the conflicting signals left me in a permanent state of total analysis paralysis. I eventually realized that to succeed, I needed to simplify my entire decision-making process. I deleted every single lagging indicator and focused my energy purely on “naked” price action and candlestick patterns.
While my charts were finally clean and easy to read, my results were still a frustrating and emotional rollercoaster. I had winning streaks followed by soul-crushing losers that wiped out my gains in a single afternoon. I realized I was missing the “fuel” or the underlying intent behind the price move. This is where the Volume Profile changed everything for me. Unlike standard indicators that just calculate past price averages or use complex mathematical formulas based on time, the Volume Profile shows you exactly where the big institutions—the entities that actually move the market—are putting their money. It allows you to improve price action trading with Volume Profile by pulling back the curtain on true market intent and liquidity.
Why Institutions Matter
The market does not move because of retail traders like us; our individual orders are far too small to shift the needle on a global scale. It moves because of massive, high-conviction orders placed by institutions. These “big players” leave footprints in the market in the form of volume. When you see a massive spike in volume at a specific price level on the horizontal axis, it means an institution was likely building a massive position there over a period of time. If the price leaves that area aggressively, those institutions will want to defend that specific price if the market ever returns to it, as it represents their average entry cost and their “line in the sand.”
Transitioning from Guessing to Knowing
By using this tool, you stop looking at a candle and wondering if it’s a “fake out” or a real breakout. Instead, you look at the volume profile on the side of your chart. If a breakout happens on low volume, it’s likely a trap designed to lure in retail “sucker” money. If it happens with a massive volume cluster sitting right behind it, you have confirmed institutional backing. This realization was the single biggest breakthrough in my professional career, moving me from a frustrated amateur who was constantly stopped out to making wins more consistently.


2. Mastering the Fair Value Gap: Improve Price Action Trading with Volume Profile
The Fair Value Gap (FVG) is a concept made popular by Smart Money Concepts (SMC) and inner-circle trading circles, and it is an incredibly powerful way to improve price action trading with Volume Profile. At its core, an FVG is a specific three-candle formation that represents a significant market imbalance. It occurs when the price moves so quickly in one direction that the market “skips” over certain price levels, leaving a physical gap between the wick of the first candle and the wick of the third candle in the sequence. This gap acts as an inefficiency that the market eventually seeks to correct.
How to Identify a Bullish FVG
In a bullish scenario, you are looking for an aggressive move upward that suggests institutional participation. Look at a sequence of three candles:
Candle 1: The high (wick) of this candle is your starting point and the lower boundary of the gap.
Candle 2: This is usually a large, aggressive green “expansion” candle that represents the breakout.
Candle 3: The low (wick) of this candle is your ending point and the upper boundary of the gap.
If there is a physical gap between the high of Candle 1 and the low of Candle 3, you have identified a Fair Value Gap. This space represents “unfair” pricing where buyers were so aggressive that sellers couldn’t keep up with the order flow. The market usually treats these gaps like a vacuum; eventually, the price likes to return to fill that gap (rebalance the price delivery) before continuing its original trend.

The Volume Profile Edge
The problem is that if you trade every FVG you see blindly on every timeframe, you will get stopped out frequently because they appear all over the charts during periods of volatility. To find the “Golden Setups,” you must look at the volume profile cluster immediately preceding the gap. If an institution spent hours or even days “rotating” (trading in a sideways range) and building a heavy volume position before the FVG formed, that level is incredibly strong and significant.
When the price eventually pulls back into that FVG and hits that heavy volume zone, you have a high-probability “Long” entry. The institutions that built their positions in that cluster will actively defend it to ensure the price stays above their average entry point. This synergy between price structure and volume data is exactly how you improve price action trading with Volume Profile. You aren’t just trading a gap; you are trading a level where thousands of contracts were exchanged.

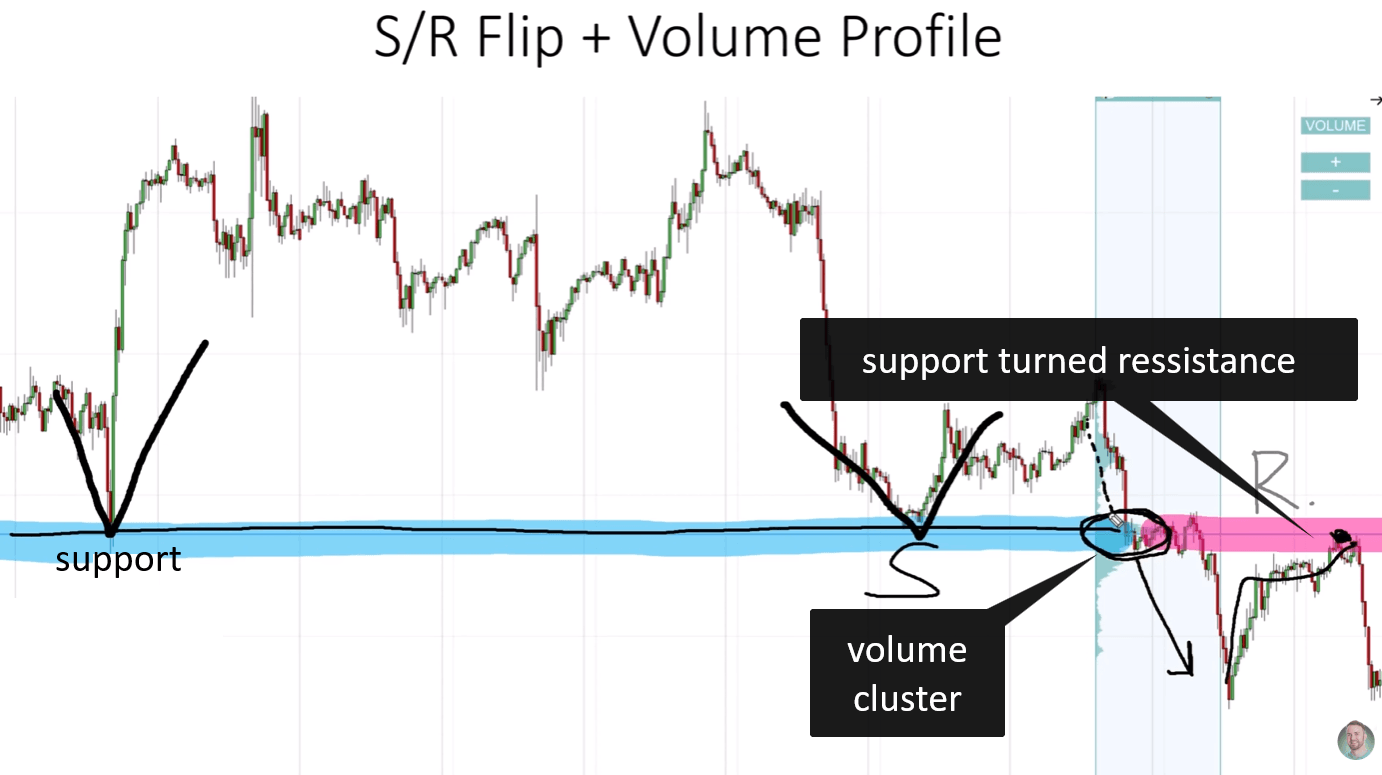
3. The Support-Resistance Flip: Why Volume Profile is key to enhance price action trading.
The Support-Resistance Flip is one of the oldest and most reliable strategies in the history of technical analysis. The logic is elegant and simple: a level that acted as a floor (support) once broken, often becomes a ceiling (resistance) upon retest. Conversely, a ceiling that is broken becomes a new floor. While this works on its own in trending markets, adding volume data is the secret to knowing which “flips” will actually hold and which ones will fail miserably, leading to what many call a “bull trap” or “bear trap.”
The Psychology of the Flip
Why does a broken support level become resistance? It comes down to the psychology of “trapped” traders and the drive to minimize pain. Imagine a level where price bounced twice—retail traders saw this and went “Long,” expecting a third bounce. However, the price breaks straight through that level. Those traders are now in a losing position and are “trapped.” When the price finally returns to that level, those traders are desperate to “break even” and close their positions. This collective selling pressure from traders exiting at the same price creates the resistance.
Adding the “Institutional Wall”
To truly improve price action trading with Volume Profile, you don’t just look for a horizontal line on a chart drawn across old peaks. You look for a significant volume cluster right at the point of the breakout. If the price broke through a support level with massive volume, it means it took a huge amount of institutional “firepower” and capital to break that floor. It wasn’t just a small move; it was a coordinated attack by large sellers.
This tells us two very important things:
The big players were very aggressive and wanted the price lower at any cost.
They invested a significant amount of capital at that specific price level, making it a “point of interest.”
When the price pulls back to that “Flip” zone, you are looking for that volume cluster to act as a physical barrier. If the volume cluster (the peak of the profile) aligns perfectly with the old support level, you have what we call a “Confluence Zone.” This is where I look to place my high-conviction trades because it isn’t just a psychological line; it’s a zone of heavy institutional interest where the big money is likely to step back into the market.
Refinement with Gaps
Sometimes, the market gives you a “Triple Threat” setup. You might see a Support-Resistance Flip that also has a Fair Value Gap and a heavy Volume Profile cluster all in the exact same spot. When these three powerful elements align, it is a high-conviction setup. You aren’t just trading a visual pattern; you are trading the actual mechanics of supply, demand, and institutional capital. This is the hallmark of a professional trader.

4. Building a Professional Trading Strategy
Now that you understand the individual components of the system, how do you put it all together into a working plan? To improve price action trading with Volume Profile, you need a repeatable, objective process. You cannot afford to trade based on “feel,” “luck,” or intuition; you need a rigid checklist that keeps you disciplined and keeps your emotions out of the decision-making process. Trading is a game of probabilities, and your job is to stack those probabilities in your favor.
Step 1: Context is King
Always start by looking at the higher timeframe (Daily or 4-Hour charts). Are we in a general uptrend or a downtrend? Volume Profile helps here too. If the “Point of Control” (the price with the most volume) is moving higher over time, it confirms that institutions are bullish. You should generally look for Bullish FVGs and Support-to-Resistance Flips that favor the long side to stay in alignment with the “big money.” Never trade against the primary institutional trend.
Step 2: Identify the Setup
Once you know the overall market direction, look for your specific price action patterns on your execution timeframe. Is there a fresh Fair Value Gap that was just created during an aggressive move? Did we just break a major resistance level that has held for weeks? Mark these zones on your chart as your primary areas of interest. However, do not enter the trade yet—wait for the final confirmation from the volume data.
Step 3: Check the Volume Profile
This is the ultimate filter that separates pros from amateurs. Look at the volume profile for the current move. Is there a significant “hump” or cluster of volume inside your price action zone?
If Yes: You have a high-probability trade. You can prepare your entry at the start of the volume cluster with confidence.
If No: The move might be “thin.” Thin moves are easily reversed because there is no institutional “floor” to support them. In this case, it’s often much better to stay on the sidelines and wait for a higher-quality setup.
Step 4: Manage Your Risk
Even with institutional volume on your side, no single trade is ever 100% guaranteed to work—the market can do anything at any time. You must always manage your risk. Always place your Stop Loss on the other side of the volume cluster. Why? Because if the price manages to trade through a heavy institutional zone, it means the big players have failed to defend it, the original trade idea is invalidated, and it’s time to get out of the position immediately.
By following this structured approach, you turn trading from a game of chance into a professional business of probabilities. You are no longer chasing green candles out of FOMO; you are waiting for the big players to show their hand, and then you are simply following their lead with precision and discipline.
5. Conclusion and FAQ
Combining price action with Volume Profile is like adding a high-definition lens to your trading terminal. You stop seeing just shapes and squiggly lines and start seeing the actual movement of capital and institutional conviction. Whether you are trading the Fair Value Gap or the Support-Resistance Flip, the goal is always the same: find where the institutions are active and align your trades with them. This is the most direct path to consistent profitability and long-term success.
Frequently Asked Questions
Q: Does Volume Profile work on all timeframes? A: Yes, the principles of volume and price are fractal and work on all timeframes, from the 1-minute chart to the Monthly chart. However, it is generally most reliable on timeframes like the 30-minute, 1-hour, or Daily charts where institutional activity and “rotations” are most clearly defined.
Q: Can I use Volume Profile for day trading and swing trading? A: Absolutely. To improve price action trading with Volume Profile, day traders might use a “Session Profile” (volume for just one day), while swing traders would use a “Fixed Range” profile to look at the volume over a multi-week or multi-month trend. The tool is incredibly versatile.
Q: Do I need expensive software to use these tools? A: Not at all. Many modern platforms like TradingView or MetaTrader offer excellent Volume Profile tools. While some advanced versions or specialized indicators are paid, the value they provide in terms of trade quality and confidence usually far outweighs the monthly subscription cost.
Next Steps:
[Click here to Master Price Action with Volume Profile] and gain exclusive access to my full institutional trading blueprint. You’ll get step-by-step video modules, live trade examples, and the proprietary indicators I use to track “Smart Money” in real-time. Don’t just watch the market—learn to lead it.