Many traders are drawn to the EMA 20 strategy because it appears remarkably simple on the surface, yet the vast majority of retail participants fail to make it work long-term. In the fast-paced world of financial markets, simplicity is often a double-edged sword. While a single moving average can provide a clean-looking chart, it often lacks the depth required to navigate complex price action. In this comprehensive guide, I draw on my years of professional trading experience to show you exactly how to filter out bad trades and turn a losing system into a profitable one using the EMA 20 and VWAP.
The “textbook” approach to moving averages frequently ignores the most critical element of any trade: market context. Without understanding whether the market is in a state of balance or imbalance, a trader is essentially gambling on every touch of the indicator. You will learn why “mechanical” trading—the kind that tells you to click a button every time a line is touched—often fails during periods of low volatility. I will demonstrate how adding a single, volume-based trend filter can fundamentally change your statistical outcomes. We aren’t just looking for a “magic” setting; we are looking to understand the logic of price movement. By the end of this article, you will see how we shifted a backtested win rate from a coin-flip 48% to a professional 60% by simply respecting the relationship between price, time, and volume.
Table of Contents
Summary of the Article
The Flaw: The standard EMA 20 pullback strategy has a win rate of only 48.5% on its own.
The Fix: Add VWAP (Volume Weighted Average Price) to identify the trend direction.
The Filter: Only take long trades if the VWAP is sloping up; only take shorts if it is sloping down.
The Result: This simple change boosted the win rate to 60% in backtesting.
Next Steps: Improve your results further by adjusting your Risk-Reward Ratio (RRR).
The Problem with the Standard EMA 20 Strategy
The EMA 20 (Exponential Moving Average) is one of the most popular indicators among retail traders. The “textbook” way to trade it is simple: when the price is in an uptrend and drops down to touch the EMA 20 line, you buy (a “long” trade). Conversely, if the price is falling and rallies up to touch the line from below, you sell (a “short” trade). It sounds perfect because it allows you to enter a move at a “discount” price.
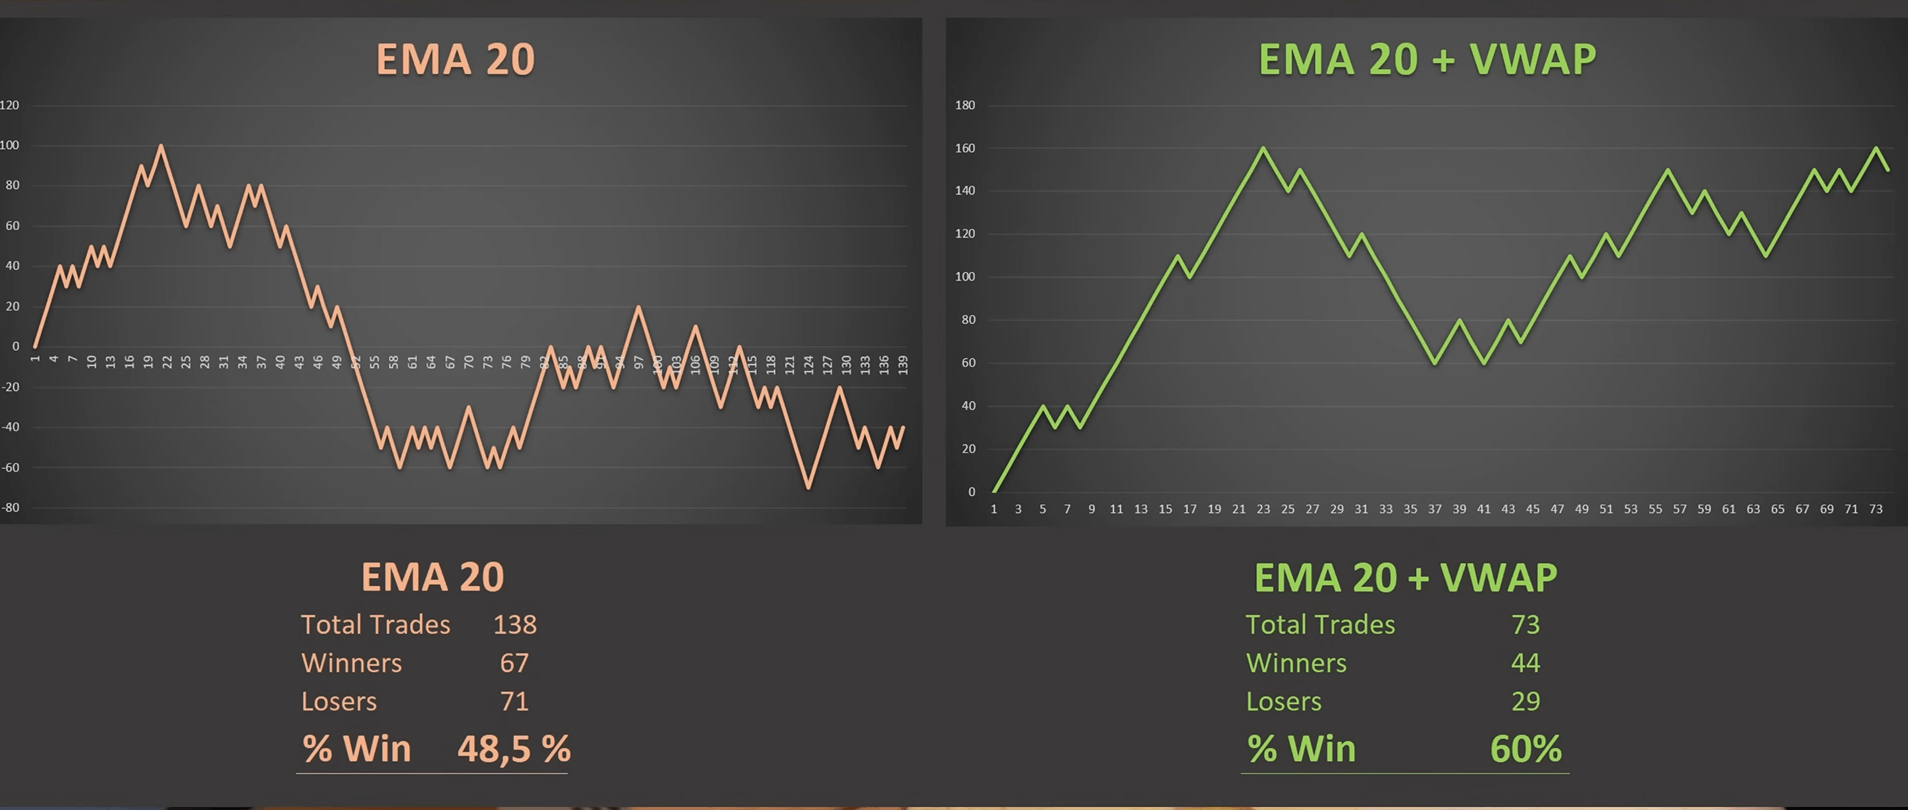
However, when we actually look at the data, the reality is quite different. I conducted a backtest on the EUR/USD pair over a two-month period. During this time, there were 138 trades. The results were eye-opening: 67 winners and 71 losers. This gives us a win rate of only 48.5%.
If you use a 1:1 risk-reward ratio (meaning you risk 10 pips to make 10 pips), a 48.5% win rate means you are losing money once you account for spreads and commissions. Trading this way is essentially the same as tossing a coin. You might win some days, but over time, your account balance will slowly drain away. The reason for this is that the EMA 20 by itself does not tell you if the market is actually trending or just “chopping” back and forth.
The indicator is just a mathematical average of past prices. It doesn’t know the difference between a healthy pullback in a strong trend and a messy sideways market where the price is just oscillating. This is the “trap” that many beginner traders fall into. They see a touch of the EMA and enter a trade immediately, without looking at the bigger picture of what the market is actually doing.

Why Most Pullback Strategies Fail in Sideways Markets
To understand how to fix a strategy, we must first understand why it breaks. After reviewing the 138 trades from my backtest, a clear pattern emerged: the strategy performed terribly during sideways markets.
In a sideways (or “ranging”) market, the price does not have a clear direction. It moves up and down within a horizontal corridor. Because the EMA 20 is a “lagging” indicator, it flattens out during these times. The price will cross the EMA 20 dozens of times in a single afternoon. If you take every “touch” as a signal, you will be “chopped up”—meaning you will take many small losses in a row as the price whipsaws back and forth.
The Mathematics of the “Chop”
When the market is sideways, the EMA 20 becomes the “mean” or the center of gravity. In statistics, price has a tendency to return to the mean. However, in a range, the price doesn’t just touch the mean and bounce; it oscillates around it. This means for every “touch” that looks like an entry, the price is just as likely to sail right through the line to the other side of the range. Retail traders see this as “the indicator failing,” but in reality, the indicator is doing exactly what it was programmed to do: averaging the price. The failure lies in the trader’s expectation that a horizontal average will act as a solid floor or ceiling.
The Psychology of False Signals
In a choppy market, your brain often “sees” trends that aren’t there. You might see two green candles and think, “Here goes the trend!” only for the price to hit the EMA 20 and immediately reverse. This leads to emotional exhaustion. After three or four losing trades in a row during a sideways market, most traders either give up or—worse—start doubling their position size to “make it back.” By the time a real trend actually starts, the trader has often blown their account or is too afraid to take the next signal.
Why Moving Averages Lack Context
Most retail traders are taught to look at indicators in isolation. They are told, “When X happens, do Y.” But professional trading is about context. A pullback to the EMA 20 is only a high-probability trade if there is a strong force pushing the market in one direction. Without that force (the trend), the EMA 20 is just a line on a screen that the price will ignore. The strategy fails because the EMA 20 is a “moving” average, but it isn’t a “trend-finding” tool. It follows the price; it doesn’t lead it.
| Market Condition | EMA 20 Performance | Reason |
| Strong Trend | Good | Acts as dynamic support/resistance. |
| Sideways/Range | Terrible | Price ignores the average and crosses it frequently. |
| High Volatility | Risky | Price often “overshoots” the EMA, hitting stop-losses. |
The Solution: Using VWAP as a Trend Filter
The secret to fixing the EMA 20 strategy isn’t adding five more indicators or changing the settings from 20 to 21. The secret is adding a Trend Filter. I chose the VWAP (Volume Weighted Average Price).
Unlike a standard moving average, which only looks at price, the VWAP looks at both price and volume. This makes it much more powerful because it shows us where the “fair value” of the market is based on how much money is actually being traded.
How the VWAP Filter Works:
Check the Slope: We don’t just look at where the price is relative to the VWAP. We look at the angle (slope) of the VWAP line.
Upward Slope: If the VWAP is pointing up, it confirms a healthy uptrend. We only look for Long trades at the EMA 20.
Downward Slope: If the VWAP is pointing down, it confirms a healthy downtrend. We only look for Short trades at the EMA 20.
Flat VWAP: If the VWAP is horizontal or “sideways,” we do nothing. We stay out of the market and protect our capital.


By adding this one rule, we are no longer “guessing” if the market is trending. We are using volume data to prove it. This filters out the “noise” of the sideways markets that destroyed our win rate in the first test. It turns a mechanical “if-then” system into a smart, context-aware strategy.
Step-by-Step Guide: How to Trade the Improved Strategy
Let’s break down exactly how to execute this strategy. We want to be very picky about the trades we take. Quality is always better than quantity in trading.
Step 1: Identify the Trend Direction
Look at your VWAP indicator. Is it clearly sloping up or down? If it is moving sideways, close your laptop and go for a walk. You should be able to see the slope easily without squinting.
Step 2: Wait for the Price to Move
If the VWAP is sloping up, the price should be trading above both the VWAP and the EMA 20. This shows that the buyers are in control. We are now waiting for a “pullback.”
Step 3: The Entry Signal
Wait for the price to drop down and touch the EMA 20. This is your entry point.
For Longs: Price hits EMA 20 from above.
For Shorts: Price hits EMA 20 from below.
Crucial Note: At the exact moment the price touches the EMA 20, check the VWAP again. If the VWAP has started to flatten out, the trade is no longer valid. We only enter if the VWAP is still showing a strong slope.
Step 4: Stop-Loss and Take-Profit
In our testing, we used a simple “1 to 1” ratio.
Stop-Loss: 10 Pips below your entry.
Take-Profit: 10 Pips above your entry.
Comparing Results: Data-Driven Performance Review
Let’s look at the “Before and After” of this strategy. This is where the numbers prove that “thinking” about the market is better than just following a basic indicator.
| Metric | Original EMA 20 Strategy | Improved (EMA 20 + VWAP) |
| Total Trades | 138 | 73 |
| Number of Winners | 67 | 44 |
| Number of Losers | 71 | 29 |
| Win Rate | 48.5% | 60.2% |
Advanced Tips: Risk-Reward and Order Flow
1. Increase the Risk-Reward Ratio
Because this strategy focuses on trends, the market often continues to move in your direction. Instead of taking profit at 10 pips, you might try aiming for 15 or 20 pips while keeping your stop-loss at 10 pips.
2. Add Order Flow Confirmation
Order Flow allows you to see the actual buy and sell orders happening inside each candle. When the price touches the EMA 20, you can look at an Order Flow chart (like a Footprint chart) to see if “Aggressive Buyers” are stepping in.
Conclusion: Elevating Your Trading Logic
Trading isn’t about finding a “magic” indicator or a secret formula that prints money while you sleep. It’s about finding a logical edge, applying it with discipline, and protecting your capital at all costs. By simply adding a VWAP trend filter to the standard EMA 20 strategy, we transformed a coin-flip system into a professional-grade trading plan. This evolution highlights a key lesson in professional trading: less is often more. We didn’t add more complex mathematical formulas; we simply added context.
When you understand that price action only matters when it is backed by volume and trend direction, you stop being a “signal hunter” and start being a market analyst. The jump from a 48% win rate to 60% is massive in the world of compounding returns. It is the difference between constant frustration and steady growth. However, remember that no strategy is a permanent fix. The market is dynamic. While this VWAP filter significantly improves the EMA 20 pullback, the ultimate goal is to move beyond purely mechanical strategies.
True consistency comes from understanding the heavy hitters in the market—the institutional volumes that drive price. This is why I eventually transitioned to Volume Profile. It provides a 3D view of the market that indicators like the EMA 20 simply cannot offer. Use the EMA 20 + VWAP strategy as a powerful stepping stone. It will teach you discipline, trend recognition, and the importance of data-driven backtesting. As you grow, keep looking deeper into the “why” behind the moves.
Common Questions (FAQ)
1. Can I use this strategy on any timeframe?
Yes, but it works best on the 30-minute or 1-hour charts. Lower timeframes have too much “noise” that can give false VWAP slopes.
2. What settings should I use for the VWAP?
Use the standard “Daily” VWAP settings. Most trading platforms (like TradingView or NinjaTrader) have this as the default.
3. Does this work for Stocks and Crypto?
It works on any liquid market where volume data is available. It is excellent for Stocks and Futures.
4. Why 20 for the EMA? Can I use EMA 50 or 200?
The 20 EMA is chosen because it represents a short-to-medium-term balance point. A 50 or 200 EMA would require much larger pullbacks, meaning you would miss many high-momentum trend opportunities.
5. What do I do if the price blows past the EMA 20?
If the price closes significantly on the other side of the EMA 20, the trade setup is likely invalidated. This usually indicates that the trend is weakening or the market is shifting into a sideways range.
6. Is VWAP better than a standard Moving Average?
For trend filtering, yes. VWAP is superior because it incorporates volume, which tells you where the majority of trading activity is occurring, rather than just where the price has been.
NEXT STEPS:
Ready to stop guessing and start trading with data? Visit trader-dale.com to download my custom indicators and master the markets.