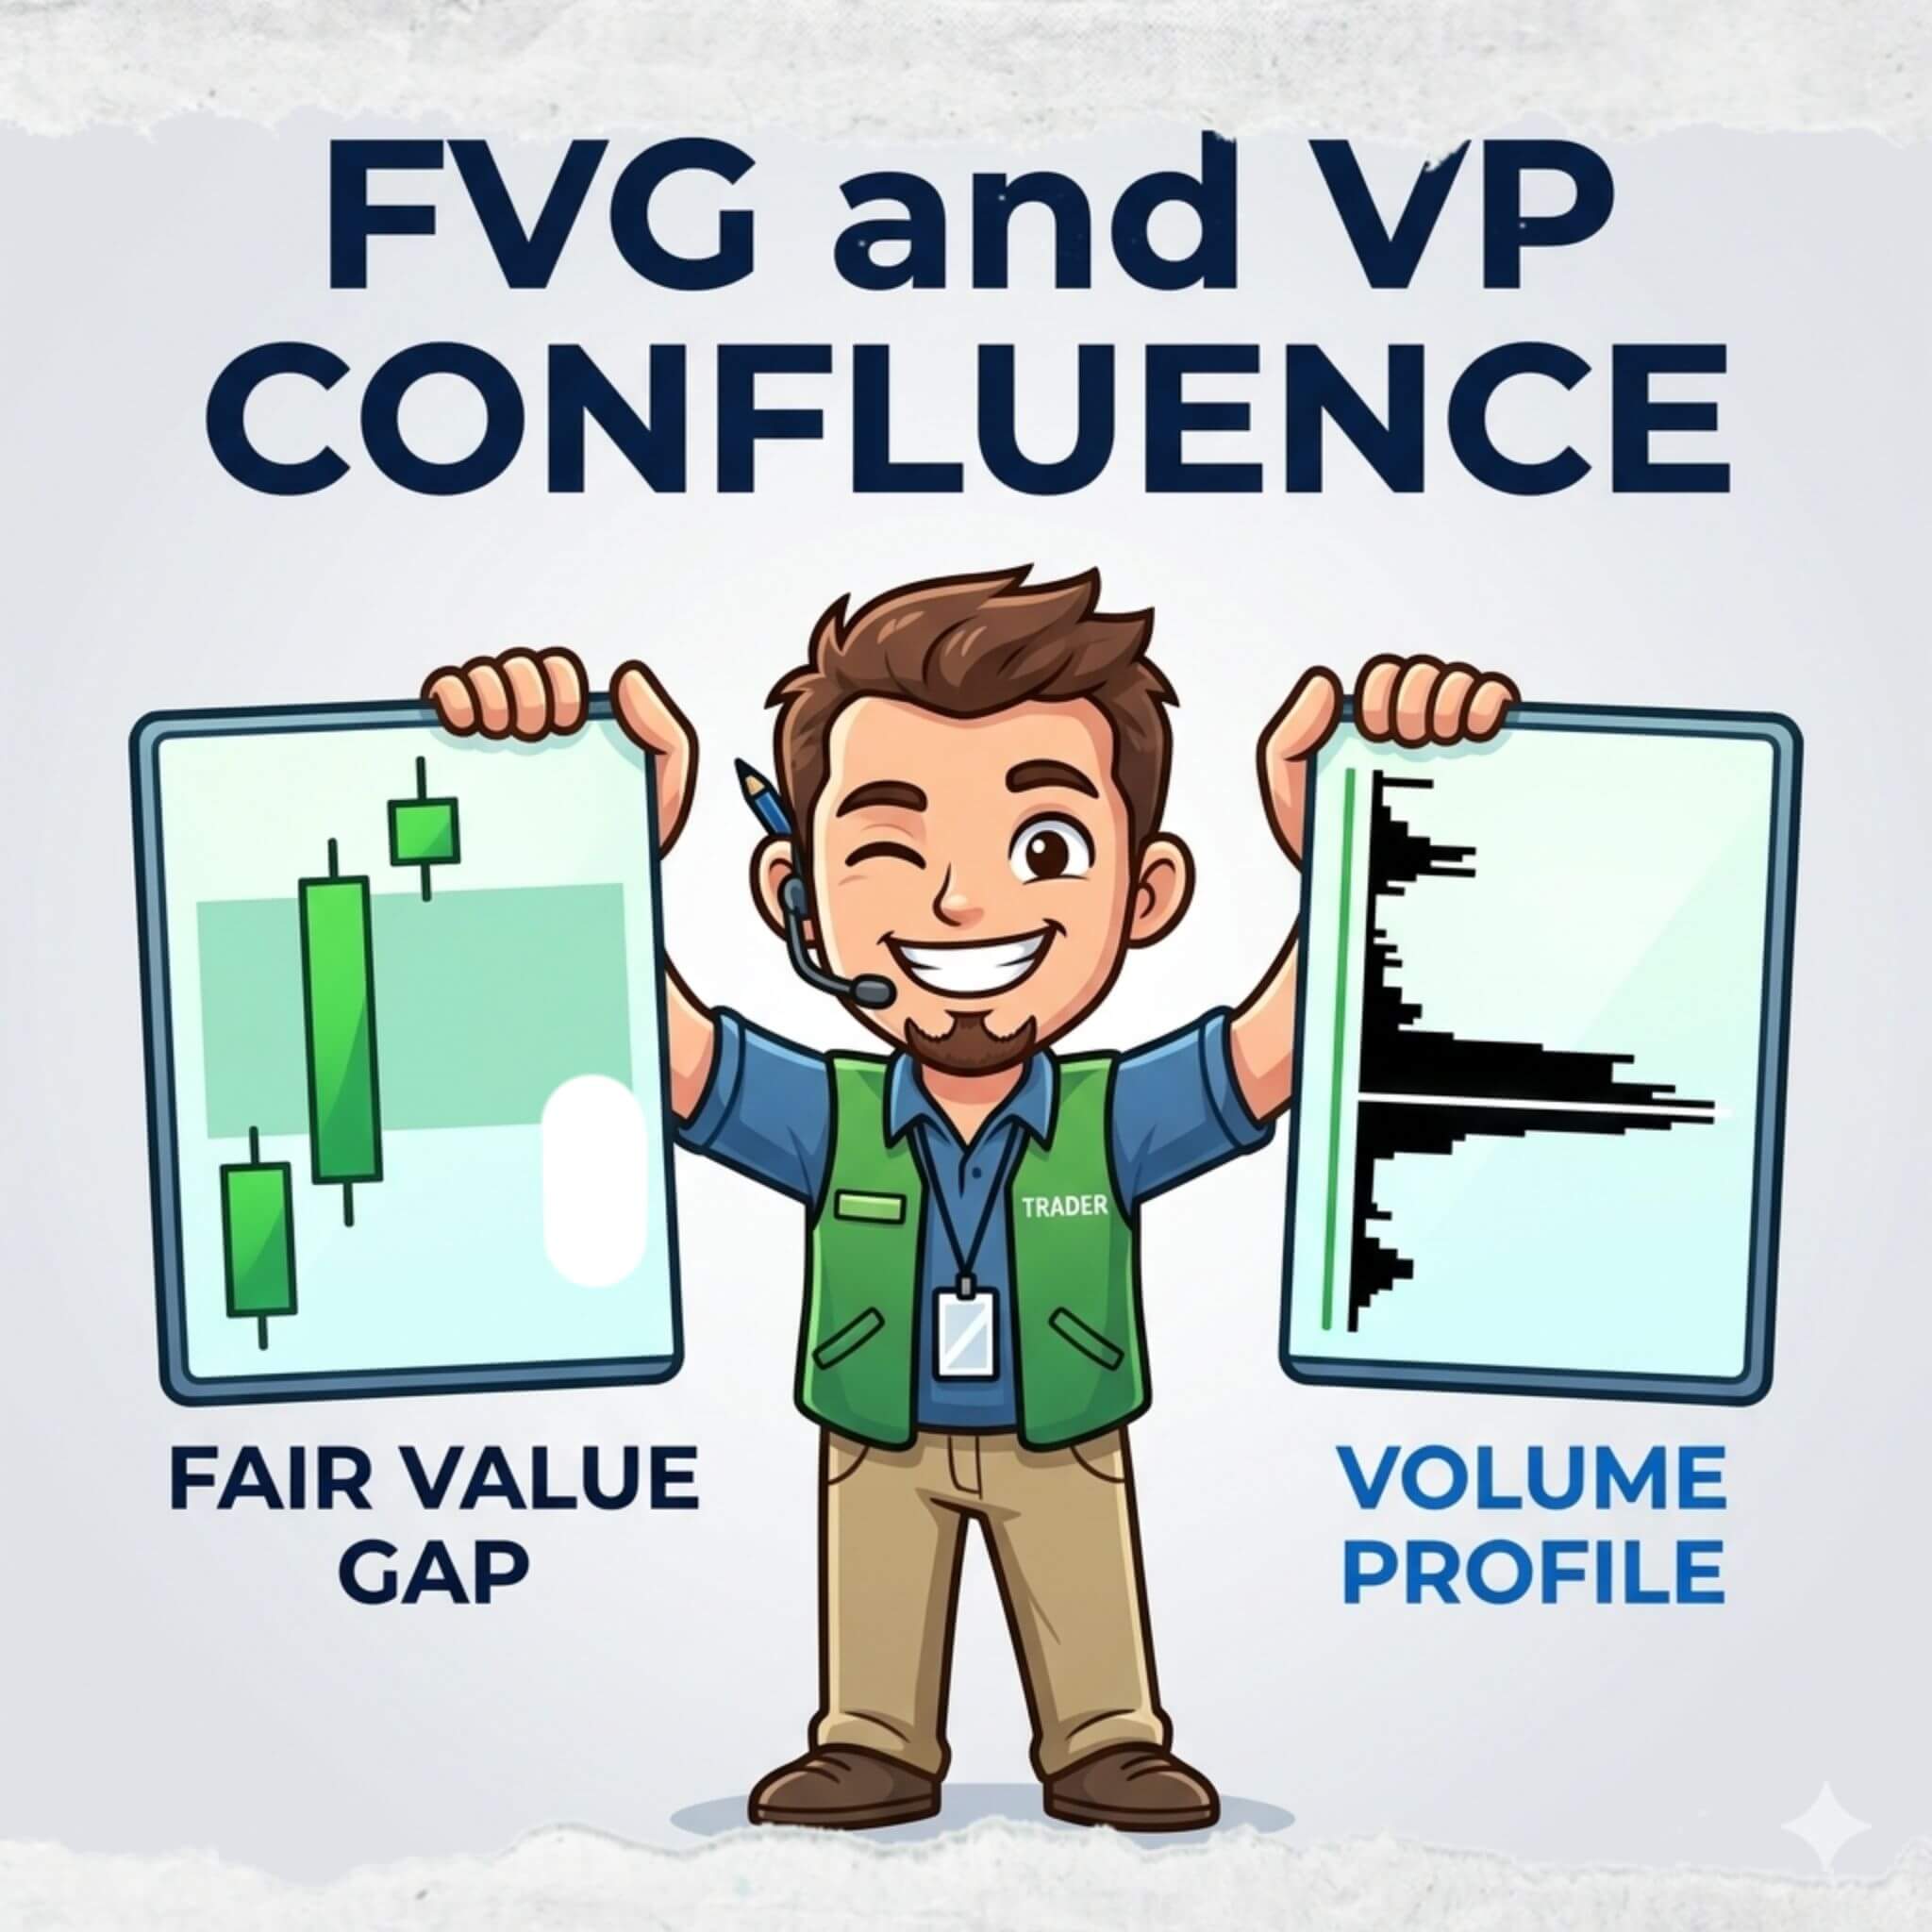
In this article, I draw on my years of experience as a professional trader to show you how to simplify the markets. Many traders struggle because they treat the market like a guessing game, jumping into trades based on a single indicator or a “gut feeling.” Over the last decade, I have found that the most consistent way to navigate price action is to stop looking at what the price is doing in isolation and start looking at why it is moving. You will learn how to combine Volume Profile and Fair Value Gaps to find high-probability trade entries that the average retail trader completely misses.
The secret to longevity in this field isn’t about finding a “holy grail” indicator; it is about finding confluence. A Fair Value Gap (FVG) tells us where the market moved too fast, creating an imbalance. A Volume Profile shows us exactly where the big institutions—the “Smart Money”—placed their biggest bets. When you see a Fair Value Gap and a heavy volume cluster align at the exact same price level, you aren’t just looking at a chart pattern; you are looking at the footprint of a bank.
By the end of this guide, you will understand how to spot these “smart money” zones and use them to improve your winning percentage. We will move away from complex jargon and focus on a teaching approach that breaks down these professional concepts into simple, actionable steps. Whether you are a beginner or looking to refine your strategy, this combination will change how you view the charts forever. By aligning your trades with institutional flow, you stop fighting the market and start flowing with it.
Table of Contents
Summary of the Article
The Core Concept: A Fair Value Gap (FVG) is a three-candle formation where price moves so fast it leaves an imbalance.
The Secret Sauce: Don’t trade FVGs alone; combine them with heavy volume clusters from the Volume Profile.
The Entry Point: The most reliable entry is usually at the beginning of the Fair Value Gap.
Win Rate: This combination often yields a higher win rate (80-90% in specific setups) compared to using indicators in isolation.
Rule of Thumb: The bigger the gap, the stronger the potential reaction.
What is a Fair Value Gap (FVG) and Why Does It Form?
To understand how to trade using Volume Profile and Fair Value Gaps, we first need to look at the anatomy of a candle chart. A Fair Value Gap is a concept from “Smart Money” trading. It represents an area where the market is “unfair.” This happens when buying or selling pressure is so intense that the price skips levels, leaving a hole in the chart. In a balanced market, every price level is touched by both buyers and sellers. When a gap forms, it means the price moved so fast that only one side of the market (either buyers or sellers) was able to execute trades. This creates a vacuum that the market eventually wants to revisit to “rebalance” or “efficiently price” that zone.
A Fair Value Gap is always a three-candle formation. It isn’t just a single candle moving fast; it’s the relationship between the candles that come before and after the big move. Think of it like a bridge where the middle section has collapsed. The market feels an “itch” to return to that missing section to make the chart whole again. This is why we call it “Fair Value”—the market is seeking a price that is fair for both sides to trade again.
The Bullish FVG
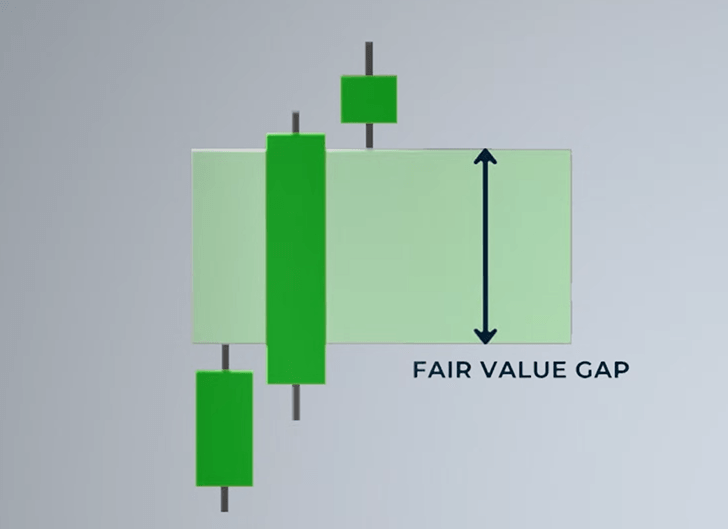
In a bullish scenario, you look at three consecutive candles moving upward.
Candle 1: The first candle sets the “floor.” We look specifically at the top of its wick (the high).
Candle 2: This is usually a large, aggressive candle that shoots upward.
Candle 3: This candle sets the “ceiling.” We look at the bottom of its wick (the low).
The “Gap” exists between the high of the first candle and the low of the third candle. If these two points do not touch or overlap, the space in between is your Fair Value Gap. This area acts as a magnet; the price likes to come back and “fill” this space because the market seeks balance. When the price eventually drops back into this gap, it often finds support because those who missed the initial move are now eager to buy at what they perceive as a “discount” price.
The Bearish FVG
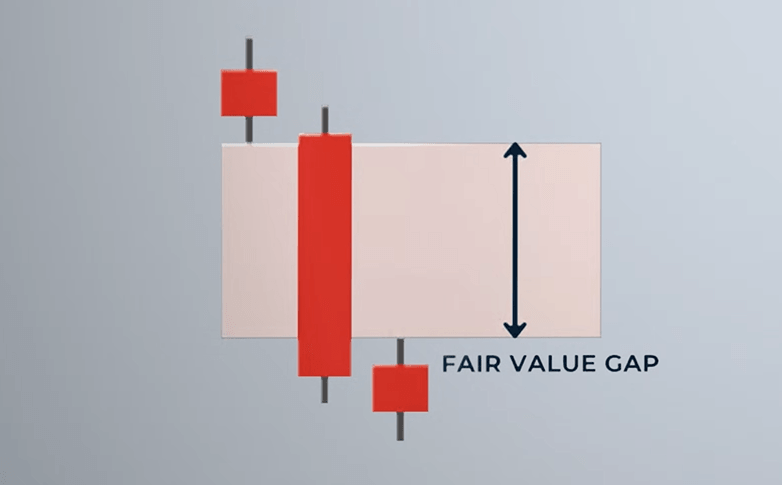
For a bearish setup, the logic is simply reversed. You look at three candles moving downward. The gap is the space between the low of the first candle and the high of the third candle. In this case, the price moved down so violently that sellers overwhelmed buyers completely. This creates a zone of “unfilled” selling interest. When the price rallies back up to touch the beginning of this bearish gap, it often hits a wall of sell orders, causing the price to drop again.
Expert Note: Many beginners make the mistake of trading every small gap they see. I don’t do that. I look for the big ones, especially those caused by major news events. Large gaps represent a massive shift in institutional sentiment. When you see a massive candle following a central bank announcement, that gap is much more reliable than a small gap during a quiet lunch hour.
| Element | Bullish FVG | Bearish FVG |
| Candle Direction | Upward / Green | Downward / Red |
| Top Boundary | Low of Candle 3 | Low of Candle 1 |
| Bottom Boundary | High of Candle 1 | High of Candle 3 |
| Market Role | Acts as Support | Acts as Resistance |

Understanding the Power of the Volume Profile
While the Fair Value Gap shows us where the price moved quickly, the Volume Profile shows us how much trading actually happened at those prices. To successfully master how to trade using Volume Profile and Fair Value Gaps, you must understand that volume is the fuel of the market. Without volume, price movement is hollow and likely to fail. The Volume Profile is essentially a X-ray for the market; it allows us to look inside the price action to see where the real “work” was being done by big traders.
The Volume Profile is an indicator that displays a histogram on your Y-axis (the price axis). Unlike standard volume bars at the bottom of your screen that show volume over time, the Volume Profile shows volume at specific price levels. This is a crucial distinction. Traditional volume tells you when people were trading; Volume Profile tells you at what price they were trading. We focus on “High Volume Nodes” (HVNs)—those horizontal peaks that look like mountains on your chart.

Heavy Volume Clusters
When you see a “bump” in the Volume Profile, we call that a Volume Cluster. This represents a price zone where big institutions—banks, hedge funds, and pension funds—were busy filling orders. These clusters are important because they show us where the “Smart Money” has a vested interest. If a bank spends three hours buying millions of dollars worth of a currency at a specific price, they are going to want to defend that price if the market ever returns to it.
If the price moves away from a heavy volume cluster very quickly, it suggests that the institutions have finished accumulating their positions and are now pushing the price. This fast move often creates—you guessed it—a Fair Value Gap. This is the moment where the “Smart Money” stops being quiet and starts being aggressive. By tracking these clusters, we are essentially following the footsteps of giants.
The Synergy
Why do we combine these two?
The FVG gives us the “Trigger Zone”—the area where the market is out of balance.
The Volume Profile gives us the “Confirmation”—the proof that the big players were actually involved.
If I see a Fair Value Gap but there is no volume cluster behind it, I am hesitant. It might just be a random price spike caused by low liquidity. However, if I see a massive volume cluster followed immediately by a big FVG, I know I have found a high-probability setup. This is because the volume proves that the big players are behind the move, and the gap shows their urgency to get the price moving. The combination creates a “confluence” that filters out bad trades and highlights the best ones.
The Strategy: Combining FVG and Volume Clusters
This is the core of the teaching. The goal is to find a specific alignment. I call this the “Combo Setup.” To find a winning trade, you aren’t just looking for a gap or just looking for volume; you are looking for them to align at the same price level. When these two powerful concepts overlap, they create a zone of high interest that is very difficult for the price to break through on the first attempt.
Step 1: Identify the Volume Accumulation
First, look for a sideways movement or a “zone” where the Volume Profile shows a significant peak. This is where the big banks were likely “collecting” their trades. They don’t just buy all at once; they build a position over time. This building process creates a thick horizontal bar on your Volume Profile. You want to see a clear “mountain” of volume that stands out from the rest of the profile. This is your foundation.
Step 2: Look for the "Breakout" FVG
Immediately following that volume cluster, there should be a sharp move (a large candle) that creates a Fair Value Gap. This is the “bang” after the quiet accumulation. The candle should be long and have very small wicks relative to its body. This shows that the market participants are in total agreement about the new direction of the price. The gap starts right where the heavy volume ends.
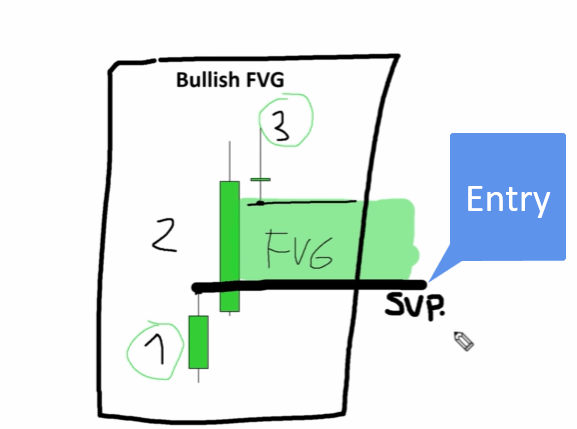
Step 3: The Alignment Rule
This is the most important part: The beginning of the heavy volume zone must align with the beginning of the Fair Value Gap. When these two levels sit on top of each other, it creates a “Hard Level.” Think of it like a wall. One indicator is a wooden fence; two indicators aligned is a brick wall. Most of my trades (about 80% to 90%) involve this specific combination because the win rate is significantly higher than using one tool alone.
Why this works in simple terms
Imagine a bank buys 10,000 contracts at a certain price. The price then rockets up, leaving an FVG. When the price falls back to that level, the bank wants to protect its original 10,000 contracts. They don’t want the price to go “into the red” for their massive position. Therefore, they will buy more at the “beginning” of that zone to keep the price from going lower. This institutional defense creates the “reaction” or the bounce that we trade. We are essentially piggybacking on the bank’s need to protect their trade.
Trading Bullish vs. Bearish Setups
Let’s break down exactly how to execute these trades. To know how to trade using Volume Profile and Fair Value Gaps, you must be able to switch your mindset between long (buying) and short (selling) scenarios. In both cases, we are looking for the “pullback.” We don’t chase the price when it is running away; we wait patiently for it to return to our identified zone of strength.
The Bullish Setup (The Long Trade)
In a bullish trend, we are looking for a “Trend Setup.”
Identify the Trend: The price is making higher highs and higher lows.
Find the Cluster: Use your Volume Profile (I prefer the Fixed Range Volume Profile) to find where the most volume was traded during that move up.
Spot the FVG: Find the bullish Fair Value Gap that started within or right at that volume cluster.
Place the Order: Set a “Buy Limit” order at the top (the beginning) of the Fair Value Gap.
The Reaction: Wait for the price to drop back down into the gap. Once it touches the beginning of the gap—where the volume cluster also sits—you expect the price to bounce back up. Your stop loss should typically go below the volume cluster, and your target should be the recent high.

The Bearish Setup (The Short Trade)
In a bearish scenario, we look for a “Rejection Setup.”
Identify the Rejection: The price fails at a high and drops sharply.
Find the Cluster: Locate the heavy volume peak at the top of the move where the sellers took control.
Spot the FVG: Look for the bearish gap that formed as the price fell away from that peak.
Place the Order: Set a “Sell Limit” order at the bottom (the beginning) of the bearish Fair Value Gap.
The Reaction: When the price “pulls back” up into that gap, it should hit the resistance of the volume cluster and fall back down. Since the sellers are still in control of that zone, they will likely sell again to keep the price down.
Simple Tip: Think of the Fair Value Gap as a “door” that the price left open. The price always wants to go back and “close the door” to make sure everything is in balance. Our job is to stand at the door frame and wait for the price to arrive. We don’t need to guess where the price is going; we just need to wait for it to come to our “trap.”

Why the Beginning of the Gap Matters Most
In many trading textbooks, you might hear that you should wait for the entire gap to be filled. They tell you to wait for the price to reach the very bottom of the gap in a bullish scenario. However, in my 10 years of experience, I have found that waiting for a full fill often means you miss the best part of the move. Professional markets are fast; if a level is truly strong, the price won’t spend a lot of time there.
The “Beginning” Rule
I always place my entry level exactly at the beginning of the Fair Value Gap.
In a Bullish move, the beginning is the High of Candle 1.
In a Bearish move, the beginning is the Low of Candle 1.
Why? Because if the level is truly strong, the institutions won’t let the price go deep into the gap. They will defend it as soon as the price touches the outer edge of the zone. If you wait for the “Full Fill,” the price might bounce $5 or $10 before it ever reaches your order. By entering at the beginning, you ensure you are “first in line” for the reaction.
Quality over Quantity
As I mentioned earlier, not all gaps are created equal. You must be selective.
Small Gaps: Often get ignored or “blown through.” They don’t represent enough institutional commitment.
Large Gaps: These are the ones we want. They show a clear imbalance.
Macro News Gaps: If a gap is formed during a central bank announcement or an employment report (like NFP), it is extremely high quality. These gaps are protected by the highest level of institutional volume.
By focusing on the beginning of the gap, you ensure that you are part of the initial reaction. Even if the price eventually goes through the level later in the day, you can often take a quick profit on the very first “touch.” This is what we call a “scalp” or a “day trade” reaction, and it is the bread and butter of my daily routine.
Conclusion and FAQ
Mastering how to trade using Volume Profile and Fair Value Gaps is about finding the point where the chart and the volume agree. When two different tools tell you the same thing at the same price, you have a professional-grade trade setup. This strategy doesn’t require you to predict the future; it only requires you to identify where the “Big Money” has already moved and wait for the market to return to that scene.
Stop trading “blind” Fair Value Gaps that have no volume behind them. Start looking for the heavy volume clusters that provide the “floor” or “ceiling” for those gaps. This simple change in your perspective—moving from a single-indicator mindset to a confluence-based mindset—will dramatically change your results.
Frequently Asked Questions
1. Does this work on all timeframes?
Yes. You can find these setups on a 1-minute or 5-minute chart for day trading, or a Daily/Weekly chart for swing trading. The logic of “Smart Money” moving the market remains the same regardless of the timeframe. However, the higher the timeframe, the more significant the reaction usually is.
2. What if the volume cluster is far away from the Fair Value Gap?
If they don’t align, the trade is much weaker. I prefer to see them overlapping or touching. If the volume cluster is 50 pips higher than the gap, the two signals are “disconnected.” I usually skip these trades and wait for a perfect “combo” setup where they line up perfectly.
3. Do I need special software for the Volume Profile?
Most modern platforms like TradingView, MetaTrader (with plugins), or Sierra Chart offer Volume Profile. It is a standard tool for professional traders today. Look for “Fixed Range Volume Profile” or “Visible Range Volume Profile.”
What your next steps should be:
If you want to see these setups in real-time and get my custom-made Volume Profile indicators, head over to trader-dale.com. Click on the “Trading Course and Tools” button to browse my education packages. You can get access to my proprietary tools and watch me apply these exact strategies to the live markets every single day. Stop guessing and start trading with the same tools the professionals use!
Happy trading, and I’ll see you in the next one!