

Hello guys,
let’s check the NZD/USD today!
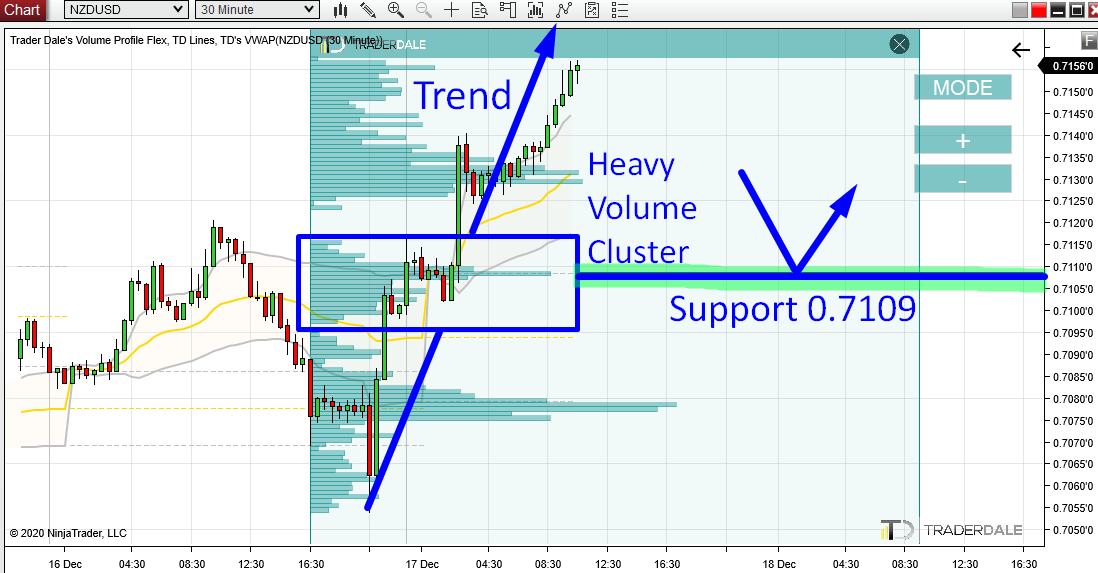
There was a pretty wild development after yesterday’s FOMC news. The price first went down after the statement release, but then it turned sharply and a strong buying activity started.
The newly formed uptrend continues until now.
When there is an uptrend I like to look for significant Volume Clusters using Volume Profile. Now, there are three such Volume Clusters in the immediate area. In this analysis, I am going to comment on the one in the middle.
Volume Cluster created within an uptrend usually indicates a place where strong Buyers were adding to their Long positions. Those places are important because those Buyers tend to defend these zones.
So, when the price makes it back into the area where the Volume Cluster got formed (around 0.7109) I expect that there will be a buying reaction = this area should work as a Support.
This setup is called the “Trend Setup“.
NZD/USD; 30 Minute chart
Price Action Confluence
If you follow me some time, then you probably know that I really like trading with confluences. Such a confluence is when two or more trading setups point to the same trading Support/Resistance.
In this case, there is also such a confluence.
The second trading setup which points to the 0.7109 support is a Price Action setup called “Resistance →Support“.
This setup is pretty simple. It says that when a Resistance gets breached it then becomes a Support.
If you look at the chart below, you can see that the price has already reacted around the 0.7109 zone in the past and that this zone worked as a Resistance. Today, the Resistance got breached and it turned into a Support.
The cool thing is that this happened around our Volume Profile level – that’s the confluence of two setups I am talking about!
NZD/USD; 60 Minute chart:

So, now two independent trading setups are pointing us to one strong trading level.
Do you want ME to help YOU with your trading?
Join one of my Volume Profile Educational courses and get my private trading levels, 15 hours of video content, my custom made Volume Profile indicators, and more!
Click Here
Yesterday’s Prediction → Result
Yesterday, I posted here a prediction of the USD/CHF.
You can read the whole analysis and prediction here:
USD/CHF: Volume Profile, Price Action, and VWAP Analysis
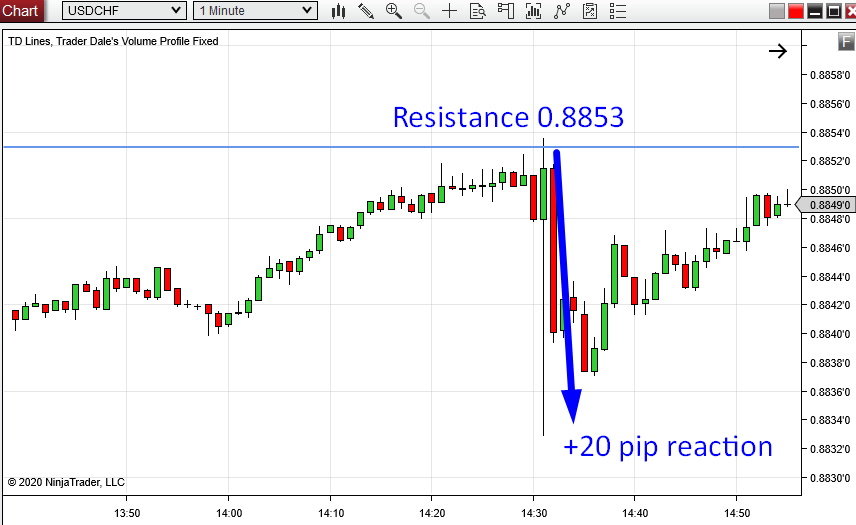
In the analysis, I showed you an intraday resistance at 0.8853. The price hit the resistance a couple of hours later and there was a super quick +20 pip reaction to it.
Unfortunately, the Resistance got hit during major US macroeconomic news release and taking this trade would be pretty risky.
So, yes – if you traded it then it was quick money, but the trade was VERY RISKY!
Here is 1 Minute chart which shows the reaction to the level:
I hope you guys liked today’s analysis. Let me know what you think in the comments below!
Happy trading!
-Dale
Volume Profile Course – 50% discount
Order Flow Course – 50% discount
*The book is now EXCLUSIVE to members of my trading courses (not available in any store)
I took the USD/CHF trade and unfortunately got stopped out by a pip or so. Thought I’d have some protection with my stop behind the DP It shows I’ve still got a lot to learn but I’ll get there with your help. Thank you again, Dale.
Yea, it didn’t breach the resistance line for too much, you should have a bit wider one if you were trading it. 🙂