
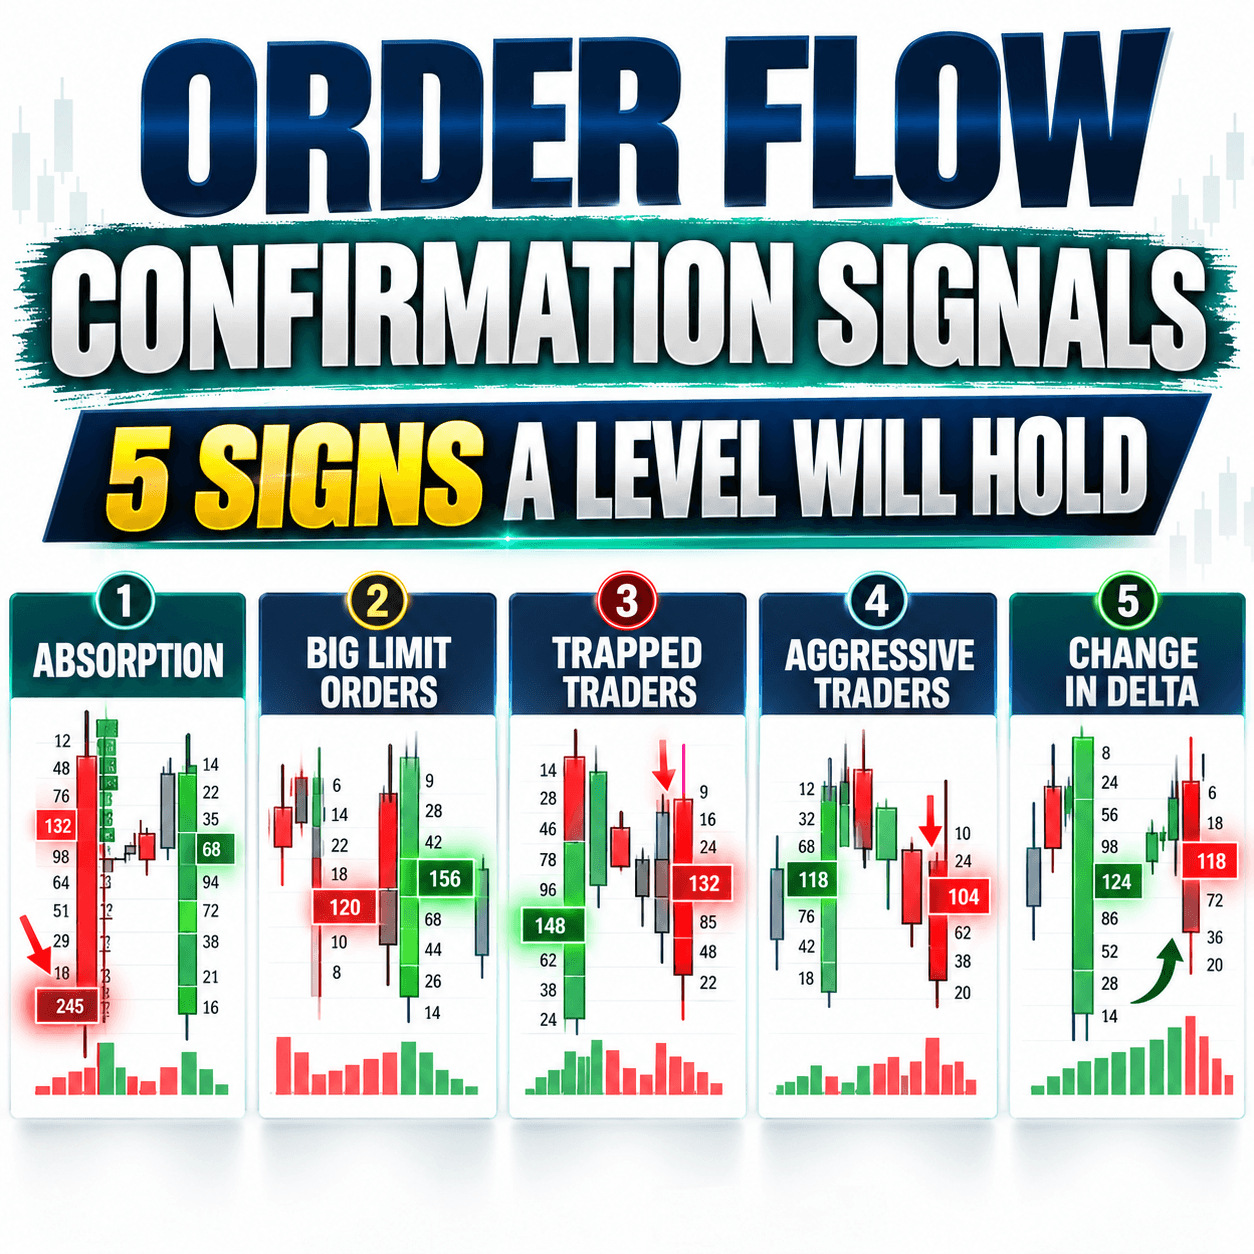
How can you tell if a support or resistance level is likely to hold? The answer is to watch what buyers and sellers do when the price gets there. That is exactly what order flow confirmation signals show you. They turn a simple line on your chart into a clear trade decision.
In this article, I will teach you the five confirmation signals I use before I enter a trade. You will learn absorption, big limit orders, trapped traders, aggressive traders and change in delta. I will explain each one in plain words, with simple pictures.
Then we will go through seven real trades on ES and Euro futures. For each one, I will tick off a simple checklist. You will see which signals appeared, when I would enter and how the trade played out.
I have traded with Volume Profile and Order Flow for many years. These checks are the same ones I use in my own trading every day.
Here is what you will learn:
- How to read the five order flow confirmations on a footprint chart
- Why every signal only counts at strong support or resistance
- How many confirmations you need before you enter
- When to skip a trade completely
Do not worry if some terms are new. By the end, you will know exactly what to look for. Let us start with a quick example.
Table of Contents
Summary of the Article in 5 Points
- Order flow confirmation signals show who takes control when the price reaches your level.
- The five signals are absorption, big limit orders, trapped traders, aggressive traders and change in delta.
- Every signal only counts at a strong support or resistance zone. Anywhere else, it is noise.
- You rarely see all five. Two or three clear signals are usually enough to enter.
- Trade only the first touch of a level. If the move already happened, skip the trade.
What Are Order Flow Confirmation Signals?
A support or resistance level tells you where the price might turn. It does not tell you if it will turn. For that, you need to see what traders are doing at that exact moment. Order flow confirmation signals give you that view.
I use a footprint chart for this. In this article, the charts come from TradingView, with a slightly customized footprint. A footprint shows how many contracts traded at the bid (sellers hitting the market) and at the ask (buyers hitting the market) at each price.
A Quick Example on Euro Futures
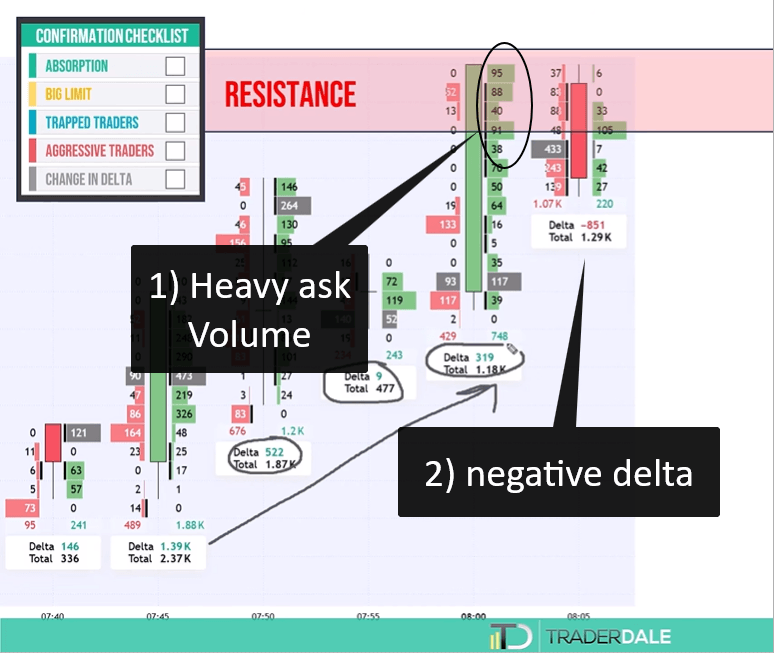
Let us look at a five minute chart of Euro futures (6E). The price was rising toward a resistance. You can find that level with any tool you like. Volume Profile, VWAP, price action, Smart Money Concepts or Fibonacci all work. I mainly use Volume Profile.
When the price first touched the resistance, I saw no reason to go short. The footprint showed heavy buying at the ask. It looked like buyers would push straight through the level.
The next five minute footprint changed everything:
- Delta turned negative. While the price was rising, delta was positive. Now sellers were in control.
- Buyers got trapped. Those heavy buy volumes at the top of the earlier candle failed to push higher.
- Aggressive sellers jumped in. Heavy volumes appeared at the bid.
That gave me three confirmations, and the price dropped from there.
The Confirmation Checklist
To keep things simple, I use a checklist with five boxes. When the price reaches my level, I tick each signal I see. The more boxes I tick, the stronger the case for the trade. My five boxes are absorption, big limit order, trapped traders, aggressive traders and change in delta. Each tick tells me that more traders agree with my idea. If no box gets ticked, I simply wait or skip the trade.
Signals 1 and 2: Absorption and Big Limit Orders
The first two signals both show big players defending a level. They often appear right at the moment the price touches your zone.
Signal 1: Absorption
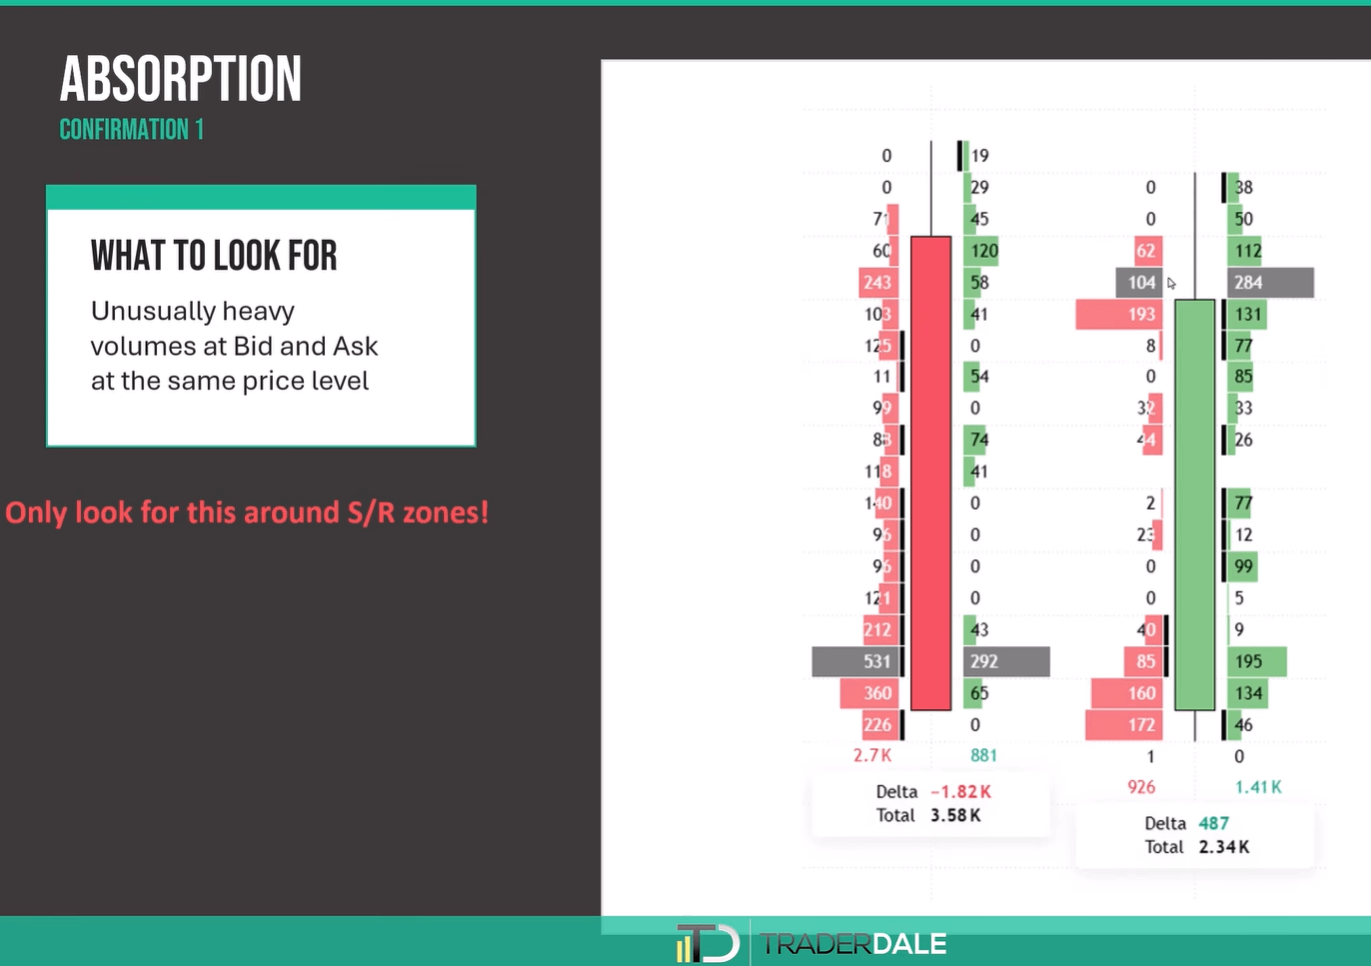
Absorption is my favorite setup. It happens when unusually heavy volumes appear at both the bid and the ask at the same price level.
Picture the price dropping into support. Heavy volume at the bid shows sellers pushing hard. Heavy volume at the ask, at the same price, shows buyers taking everything those sellers offer. The selling is being absorbed. That is why the price stops, and why a reaction often follows.
The two numbers do not need to match exactly. They just need to be clearly heavier than normal. For a deeper look, read my article on [order flow volume absorption] (internal link).
Signal 2: Big Limit Orders
This one surprises many traders. For a short trade, you look for unusually heavy volume at the ask near resistance. For a long trade, you look for unusually heavy volume at the bid near support.
Why? Heavy volume at the ask usually means strong buyers, but only if they used market orders. At a resistance, it is more likely a big seller with a limit sell order. A limit sell order shows up at the ask. A limit buy order shows up at the bid.
In one of my examples, 193 contracts appeared at the ask right at resistance. That was most likely a big seller waiting for the price, not an eager buyer.
Signal | Short Trade (at Resistance) | Long Trade (at Support) |
Absorption | Heavy bid and ask at one price | Heavy bid and ask at one price |
Big limit order | Heavy volume at the ask | Heavy volume at the bid |
As you can see, the long version of both signals is simply reversed. Look for them only when the price sits inside your zone. Out in the open, the same numbers do not mean much.
Signals 3 to 5: Trapped Traders, Aggressive Traders and Delta
The next three signals show traders reacting to your level. Together with the first two, they complete the checklist.
Signal 3: Trapped Traders
Here, traders get caught on the wrong side. In a short scenario, the price rises and shows heavy buying near the top of a candle. It looks like the market will keep going up. But then the next footprint turns bearish.
Those buyers could not push through. Sooner or later, they must exit their long positions with market sell orders. Their exits add fuel to the drop.
Imbalances make this signal stronger. An imbalance means one side was much more aggressive than the other, compared diagonally. TradingView marks them with small black bars. Buying imbalances near the high, followed by a bearish candle, scream trapped buyers. My article on [order flow trapped traders] (internal link) covers this setup step by step.
Signal 4: Aggressive Traders
Aggressive traders are strong market orders pushing the price away from your level. At resistance, you want to see heavy volume at the bid. That means aggressive sellers are jumping in. At support, you want heavy volume at the ask from aggressive buyers.
Often, these traders notice the reaction at the level and want to join the move. When you see them, you have another reason to join too. Like every other signal here, this one means little in the middle of nowhere.
Signal 5: Change in Delta
Delta is the difference between aggressive buyers and aggressive sellers. Most footprint tools print it below each candle, so it is the easiest signal to spot.
At resistance, you want delta to flip from positive to negative. That shows sellers taking control. At support, you want it to flip from negative to positive.
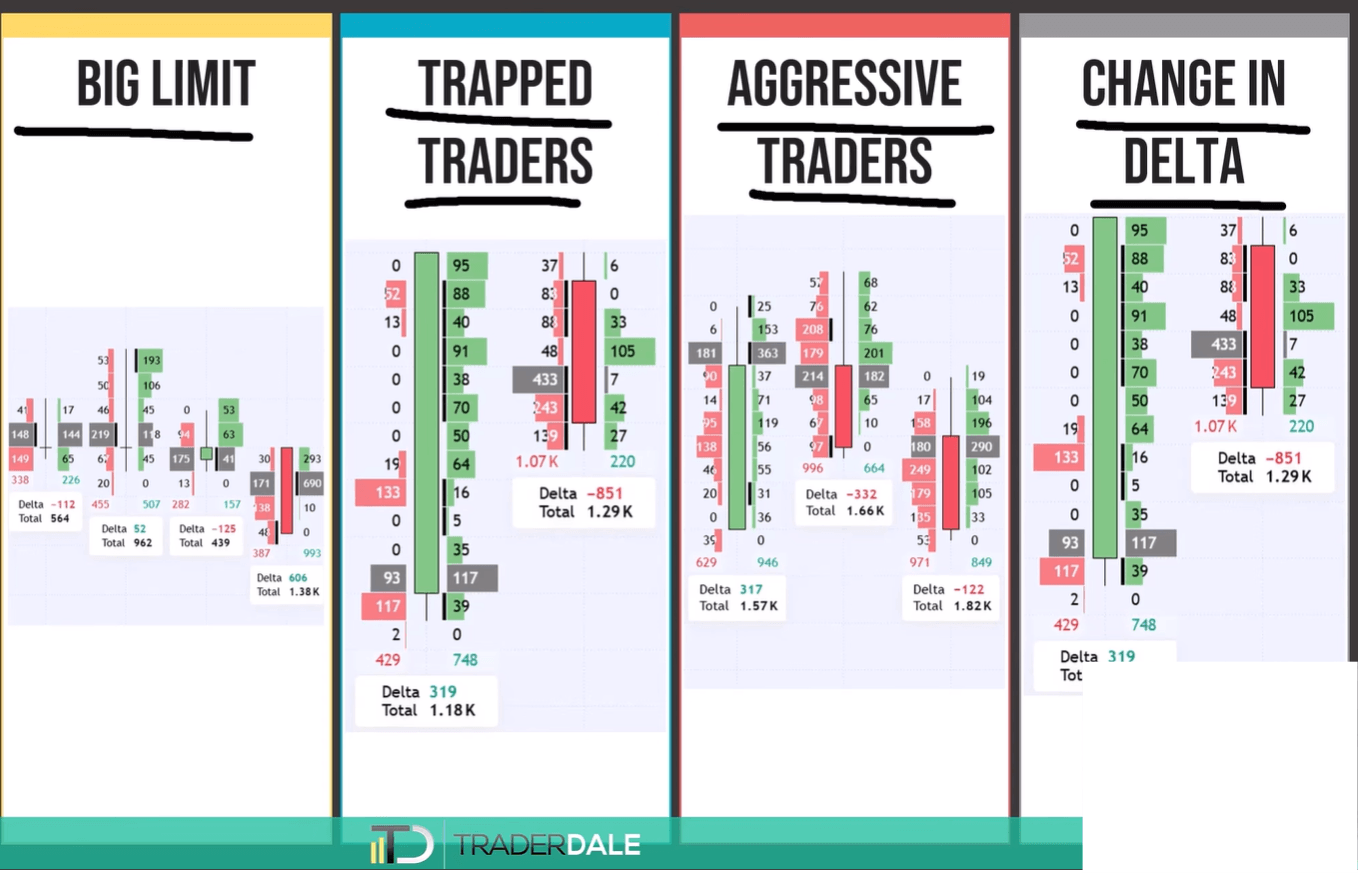
Remember: all five signals only matter around strong support or resistance. Away from a level, they are just noise.
Real Trade Examples: Order Flow Confirmations on ES
Now let us use the checklist on real trades. These three examples are on ES futures, all on five minute footprint charts.
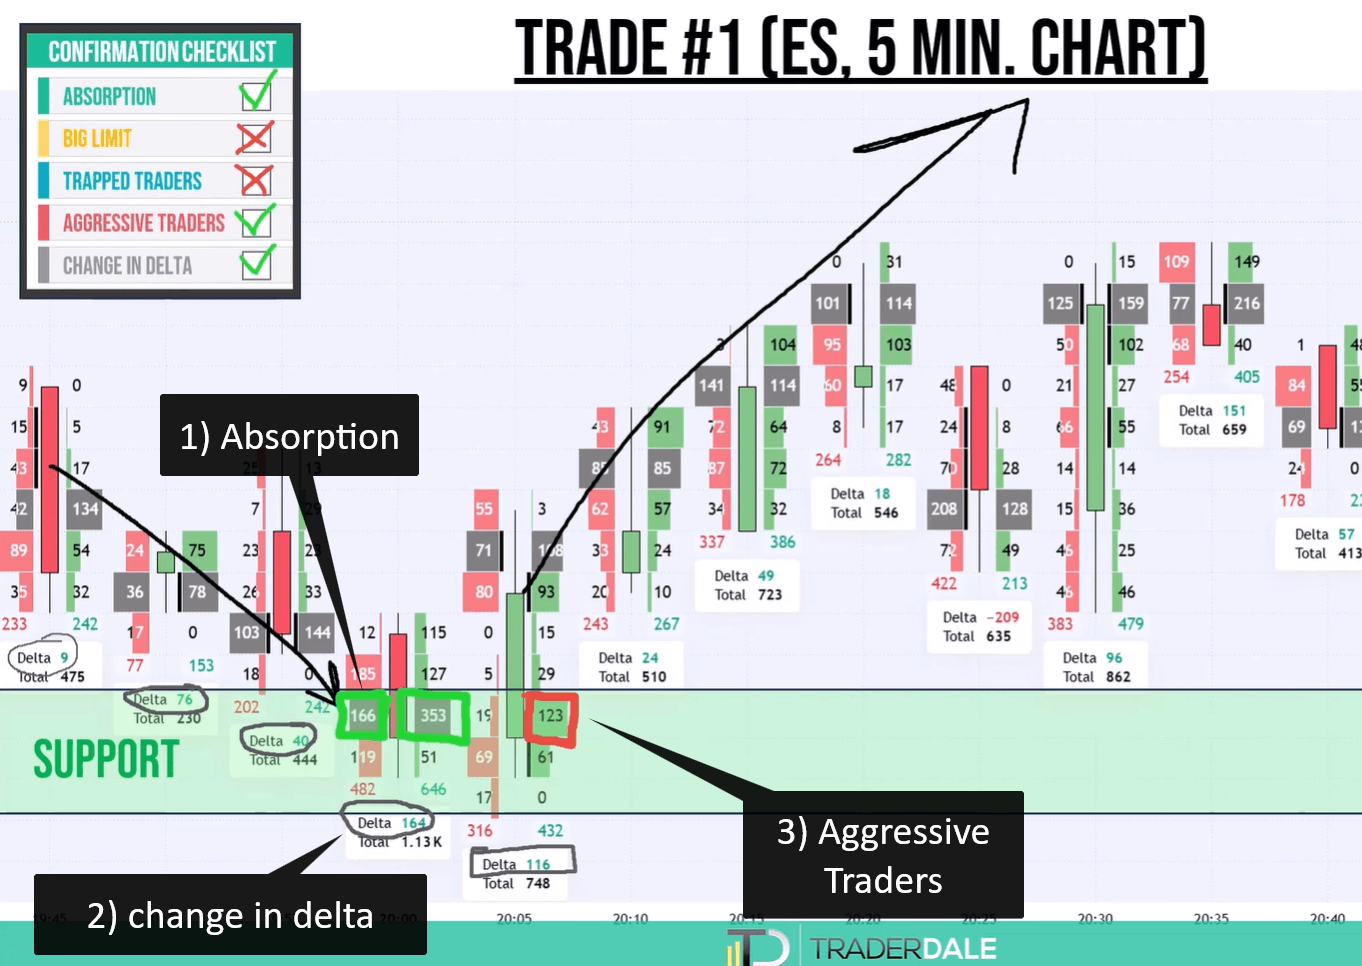
Trade 1: ES Long at Support
The price dropped into support. Right away, I saw absorption: heavy volume at both the bid and the ask near the level. I also noticed something interesting. Even though the price was falling, every delta was positive. Buyers were quietly in control.
With two confirmations, I would already enter at the close of that candle. A safer trader could wait one more footprint. That next footprint showed aggressive buyers, with 123 contracts at the ask inside the support zone.
That made three confirmations. The price reacted nicely and moved up.
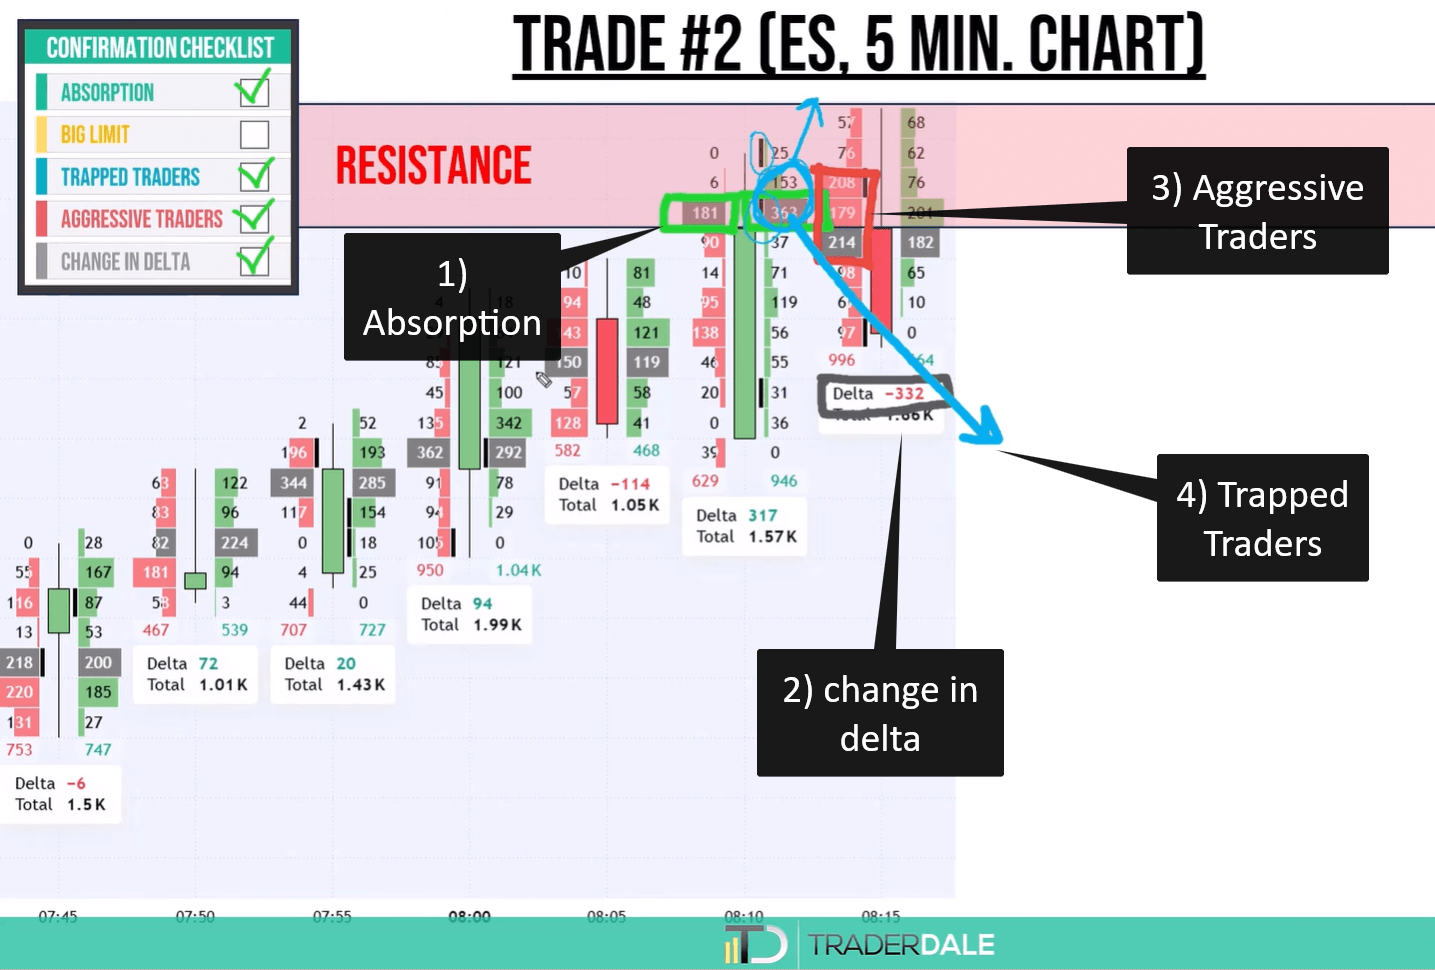
Trade 2: Short at Resistance With Four Signals
At first, I only saw absorption at the resistance. I am a fairly aggressive trader, so this alone could be enough for me. A more careful trader would wait.
The next footprint added a lot:
- Change in delta: delta finally turned negative.
- Aggressive sellers: heavy volumes and red cells at the bid.
- Trapped traders: buying imbalances failed, and the footprint closed bearish.
Four confirmations put the odds clearly on my side. The price dropped.
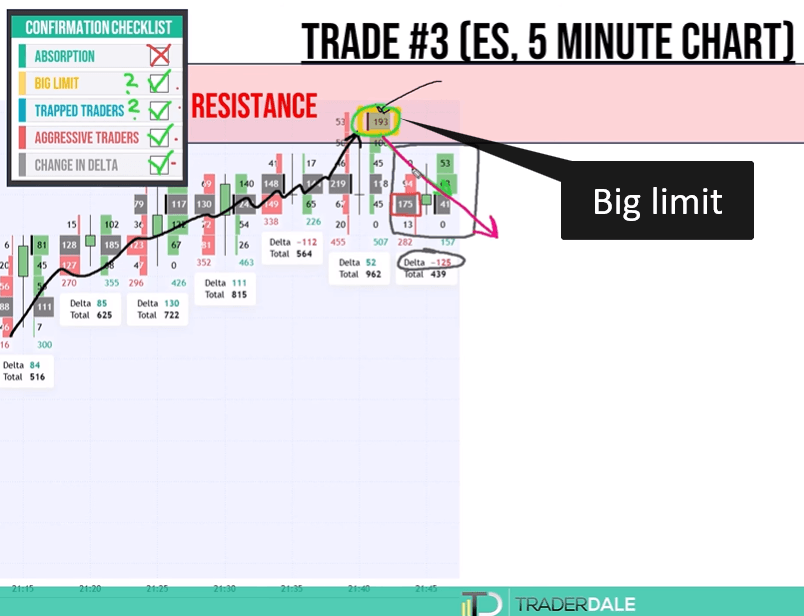
Trade 3: ES Short After a Big Limit Order
The price climbed slowly into resistance. A heavy volume at the top of the candle appeared, likely a big limit order. I waited for the next footprint.
It showed a delta flip to negative and aggressive sellers, with 175 contracts at the bid on the high volume node. Looking back at that heavy top volume, it could have been a big limit order or trapped buyers. Either way, it counted. There was no absorption.
Trade | Absorption | Big Limit | Trapped | Aggressive | Delta |
1: ES long | Yes | No | No | Yes | Yes |
2: Short | Yes | No | Yes | Yes | Yes |
3: ES short | No | One of these | One of these | Yes | Yes |
More Order Flow Confirmation Signals on Euro Futures
The next three trades come from Euro futures and ES. One of them is the best case you can hope for.
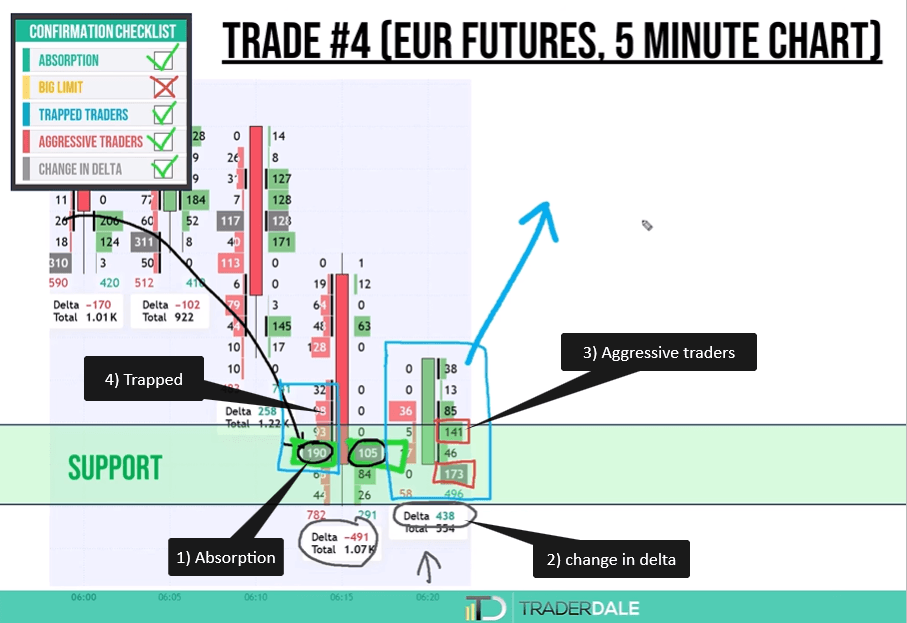
Trade 4: Euro Futures Long With Four Signals
At support, I saw 109 contracts at the bid and 105 contracts at the ask on the same price. That is absorption: sellers pushing down, buyers taking it all.
The next footprint confirmed it:
- Delta flipped from negative to positive.
- Aggressive buyers appeared, with 141 and 173 contracts at the ask.
- Trapped sellers were left behind, because selling imbalances failed and the candle closed bullish.
Four boxes were ticked. As an aggressive trader, I would enter right after the absorption. A conservative trader could enter after the second footprint.
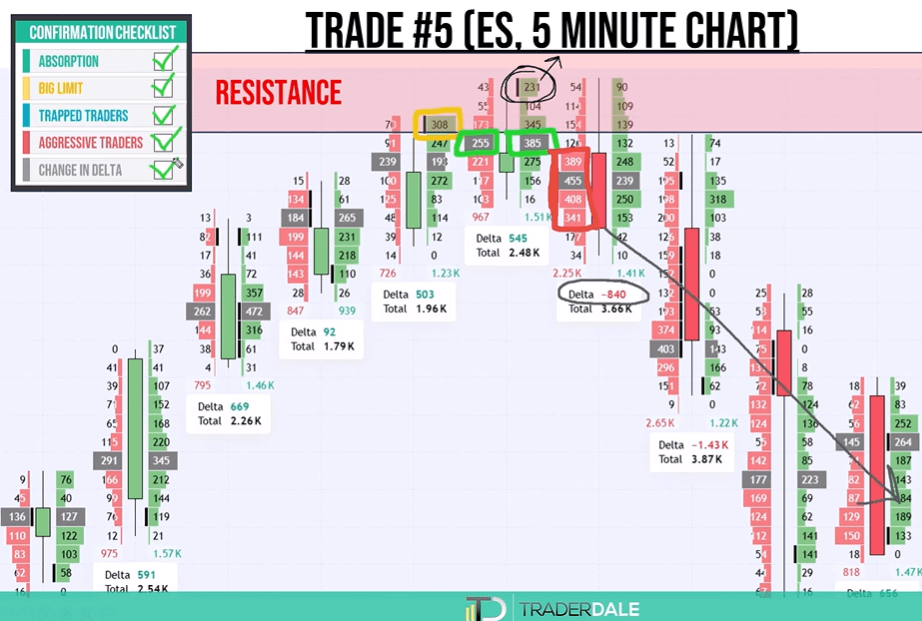
Trade 5: ES Short With All Five Signals
This one was special. At resistance, a big limit sell order appeared at the ask. The next footprint showed absorption close to the level.
One more footprint made the picture clear. Earlier, 231 contracts with an imbalance had printed at the top of a candle. When the next candle turned bearish, those buyers were most likely trapped. Aggressive sellers then joined with heavy bid volumes, and delta turned negative.
Every box was ticked. Nothing in trading is safe, but this is as good as a setup gets.
Trade 6: Euro Futures Short
The price rose into resistance. A heavy volume at the ask suggested a sell limit order. At the same time, delta turned negative.
The next footprint kept delta negative and showed aggressive sellers. The heavy volume at the top could also have been trapped buyers. There was no absorption. Even so, this was a resistance worth trading. I would go short at the close of the first footprint. A more careful trader could wait and sell at the close of the second one. Both entries gave the trade room to work, and the price dropped.
When Should You Skip a Trade Even With Confirmation?
Confirmation signals help you enter. They also help you see when not to enter. The last example shows this clearly.
Trade 7: The Trade That Came Too Late
The price was dropping fast into support on Euro futures. Right at the level, I saw beautiful absorption. Nothing else was there yet.
As an aggressive trader, I would probably enter right there. Many traders would rather wait for the next footprint. Here is the problem. When that next footprint closed, it showed a change in delta and trapped sellers. But the price had already bounced strongly away from the level.
At that point, chasing the market makes no sense. The level is spent. I only trade the first touch of a level. So you either entered at the absorption, or you skipped the trade. Those late signals are still useful for learning. They prove the level was real. They simply arrived after the best entry was gone.
How Many Confirmations Do You Need?
You will rarely see all five signals. Here is how I think about it:
- At a strong level with one very clear signal, I may enter.
- Two or three confirmations are usually enough.
- More confirmations are better, but waiting too long can cost you the entry.
Trader Style | When to Enter | Trade Off |
Aggressive | After the first clear signal | Better price, less proof |
Conservative | After two or three signals | More proof, risk of missing the move |
Neither style is wrong. What matters is that you pick one and stay consistent.
No Shame in Missing a Trade
If you are not sure, or the market moves too fast, let it go. It is better to miss a trade you are not sure of than to get caught in a bad one. There will always be another level and another setup.
Conclusion
Order flow confirmation signals answer one key question. Will this support or resistance level hold? Instead of guessing, you watch what buyers and sellers do when the price arrives.
Let us review the five signals. Absorption shows heavy bid and ask volume at one price. A big limit order appears at the ask near resistance or at the bid near support. Trapped traders are aggressive buyers or sellers who fail and must exit. Aggressive traders jump in with market orders in your direction. A change in delta shows the side in control flipping at your level.
Always look for these signals at a strong support or resistance zone. Away from a level, they mean very little. You also do not need all five. Two or three clear confirmations usually give you a solid reason to enter.
The real trades showed every version of this. Some trades had three signals, one had all five, and one came too late to take. That last one matters just as much. Trade only the first touch, and never chase a level that is already spent.
Start by printing a simple five box checklist. Each time the price reaches one of your levels, tick what you see. With practice, you will read the footprint much faster and with more confidence.
FAQ
What are order flow confirmation signals?
They are footprint chart signals that show who takes control at a support or resistance level. The five I use are absorption, big limit orders, trapped traders, aggressive traders and change in delta.
How many order flow confirmations do I need to enter a trade?
Usually two or three. At a very strong level, one clear signal can be enough. More signals are better, but waiting too long can make you miss the entry.
Why does heavy volume at the ask near resistance mean selling?
At resistance, heavy ask volume is often a big seller using a limit sell order. Limit sell orders show up at the ask, while limit buy orders show up at the bid.
Learn the Full Order Flow Strategy
If you want to learn my complete Order Flow strategy from A to Z, I can help. You will also get my custom made Order Flow indicators and join the Trader Dale trading community.
Visit trader-dale.com and click Trading Course and Tools to browse my trading education and indicators. You can also grab my Order Flow book. Readers in the US can get a free printed copy with free shipping, and an ebook version is available for everyone else.