
Order flow trapped traders are one of the clearest signals you can find on a footprint chart. The idea is simple. A group of aggressive traders pushes hard in one direction. Then the price refuses to follow them. Those traders are now stuck in losing positions, and the market often moves the other way.
In this article, I will teach you the trapped traders setup step by step. I will start with a simple drawing so you can see the concept clearly. Then I will walk you through a real trade I took on Euro futures. You will see the exact chart, the exact level, and the exact moment I entered.
I have used Volume Profile and Order Flow in my own trading for many years. I also call trades in advance for members of my trading course. So everything here comes from real screens and real trades, not from theory.
Here is what you will learn:
- What trapped buyers and trapped sellers really are
- Why this setup only works at strong support or resistance
- How to read imbalances and delta on a footprint chart
- How a real short trade looked from start to finish
By the end, you will know exactly what to look for. You will also know when to ignore the signal, which is just as important. Let us begin with the basics.
Table of Contents
Summary of the Article in 5 Points
- Trapped traders are aggressive buyers or sellers who push hard but fail to move the price.
- When buyers fail, it shows that sellers are stronger. When sellers fail, it shows that buyers are stronger.
- The signal only counts at a strong support or resistance zone. Anywhere else, it is just noise.
- Look for stacked imbalances close to the high (for shorts) or the low (for longs), followed by a reversal candle.
- A delta flip in the next footprint adds one more layer of confirmation.
What Are Order Flow Trapped Traders?
Let us start with a simple picture. Think of it like a tug of war. One team pulls very hard. But the rope does not move their way. Instead, it slides to the other side. The team that pulled hard is now worn out and losing.
That is the core of order flow trapped traders. A group of traders acts very aggressively. The footprint chart shows their heavy activity. But the price does not reward them. Instead, it turns against them.
The Basic Idea in Plain Words
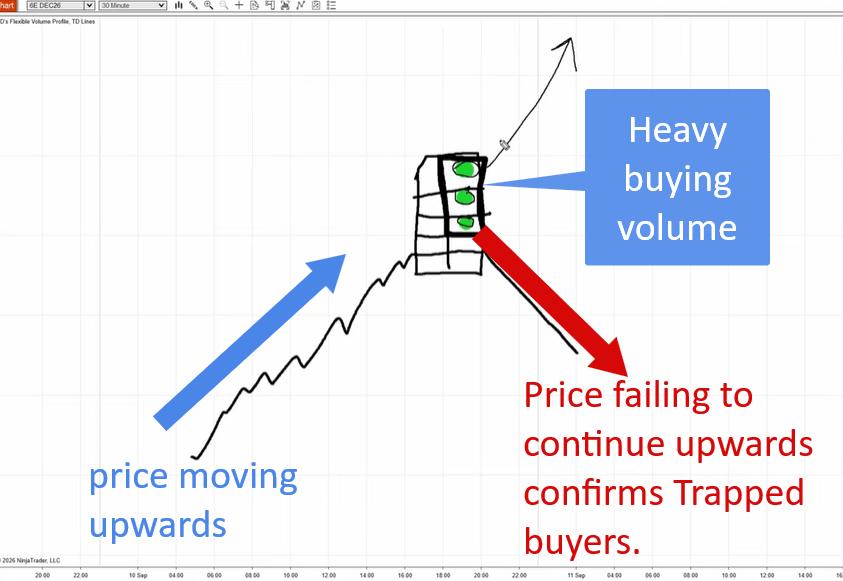
Imagine a short trade scenario. The price goes up. Near the high of a candle, the footprint shows heavy buying at the ask. You see big numbers in several cells close to the top.
Normally, this would tell you that aggressive buyers are in charge. You would expect the price to keep rising.
But now imagine the price does not follow through. Instead of going higher, it starts to drop. Those aggressive buyers just bought near the top. Now the market is moving below their entry. They are stuck in losing long positions. We call them trapped buyers.
Why Failed Buyers Tell You Sellers Are in Control
Here is the key lesson. When strong buyers fail, it gives you information about the other side. If buyers were aggressive and still could not push the price up, someone stopped them. That someone is the sellers.
So the failure of buyers tells you that sellers are in control. Sellers are stronger than those buyers. For that reason, the price should go lower.
Let us do a quick recap. Two things must happen:
- There must be a clear signal of strong buyers pushing the price up.
- Those buyers must fail, and the price must reverse.
That is the whole concept. When you see this, you have a reason to enter a short trade. Trapped traders are a confirmation, not a full strategy on their own.
One small note on the name. Those buyers are not really trapped. They can close their positions at any time. But traders like to use this term, so I stick with it too.
How the Trapped Traders Setup Works in Short and Long Trades
The good news is that this setup works in both directions. Once you understand the short version, the long version is easy. It is the same idea, only flipped upside down.
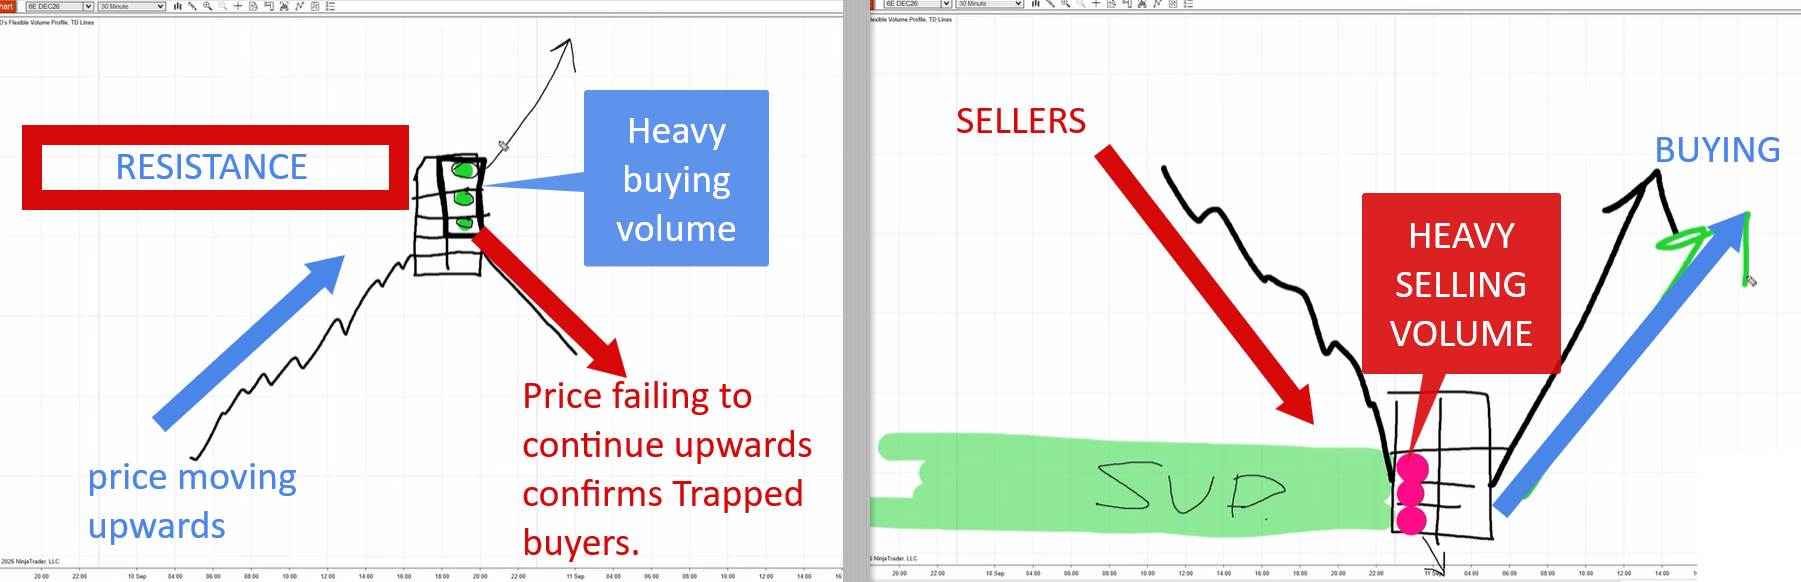
The Short Trade Scenario
In a short trade, you are looking for trapped buyers. Here is the order of events:
- The price rises into a resistance zone.
- A footprint candle shows strong buying at the ask close to its high.
- The next candle does not continue up. Instead, it closes lower.
- The buyers are now trapped, and you enter short.
The important part is the failure. Strong buying alone is not a signal. Strong buying that leads nowhere is the signal.
The Long Trade Scenario
In a long trade, you are looking for trapped sellers. Everything is reversed:
- The price drops into a support zone.
- A footprint candle shows strong selling at the bid close to its low.
- The next candle does not continue down. Instead, it closes higher.
- The sellers are now trapped, and you enter long.
Here, aggressive sellers tried to push the price lower. They failed. This tells you that buyers are stronger, so the price should go up.
Short vs Long at a Glance
This table puts both scenarios next to each other.
Feature | Short Trade (Trapped Buyers) | Long Trade (Trapped Sellers) |
Where it happens | At resistance | At support |
Aggressive side | Buyers at the ask | Sellers at the bid |
Where volume sits | Close to the candle high | Close to the candle low |
What fails | Price does not go higher | Price does not go lower |
Next candle | Closes lower | Closes higher |
Delta in next candle | Turns negative | Turns positive |
Your trade | Enter short | Enter long |
As you can see, the logic is a mirror image. If you learn one side well, you already know the other side.
Why Location Matters for Trapped Traders
This is the part many traders skip. And it is the part that matters most. You should not look for trapped traders anywhere on the chart. You need to see them around a strong support or resistance zone.
Why the Signal Is Noise Without a Level
Footprint charts are full of activity. Every few minutes, some group of traders pushes hard and fails. If you treat every one of those moments as a signal, you will take far too many trades. Most of them will be random.
Think of it like a smoke alarm. If it goes off in the kitchen while you cook, it is probably nothing. If it goes off at night in an empty room, you pay attention. The location gives the signal its meaning.
The same is true here. Trapped traders in the middle of nowhere do not mean much. Trapped traders right at a strong resistance tell a clear story. Buyers tried to break the level. They failed. Sellers defended it. That is a story you can trade.
So the process always looks like this:
- First, find a strong zone.
- Wait for the price to reach it.
- Only then, look for trapped traders as your confirmation.
Tools for Finding Strong Zones
It is up to you which tool you use to find support and resistance. You can learn more about the general idea of support and resistance on Wikipedia. Here are some common choices:
Tool | What It Shows | How It Helps |
Volume Profile | Where big volume was traded | Finds levels where large players are active |
Smart Money Concepts | Order blocks and liquidity areas | Finds zones where price often reacts |
Fibonacci | Retracement levels | Finds possible pullback areas |
Classic swing levels | Old highs and lows | Finds obvious turning points |
I personally like to use Volume Profile. It shows me where heavy volume was traded, which often means big players were involved. If you want to go deeper, read my article on [order flow volume clusters] and my guide to [high volume node pullback trading].
How to Read Imbalances and Delta on the Footprint Chart
To spot trapped traders, you need to read a bid x ask footprint chart. Do not worry. It is easier than it looks. You only need to understand two things: imbalances and delta.
What Is an Imbalance?
An imbalance shows that one side of the market is much more aggressive than the other. The rule is simple. If one side is three times or more stronger than the other, it is an imbalance.
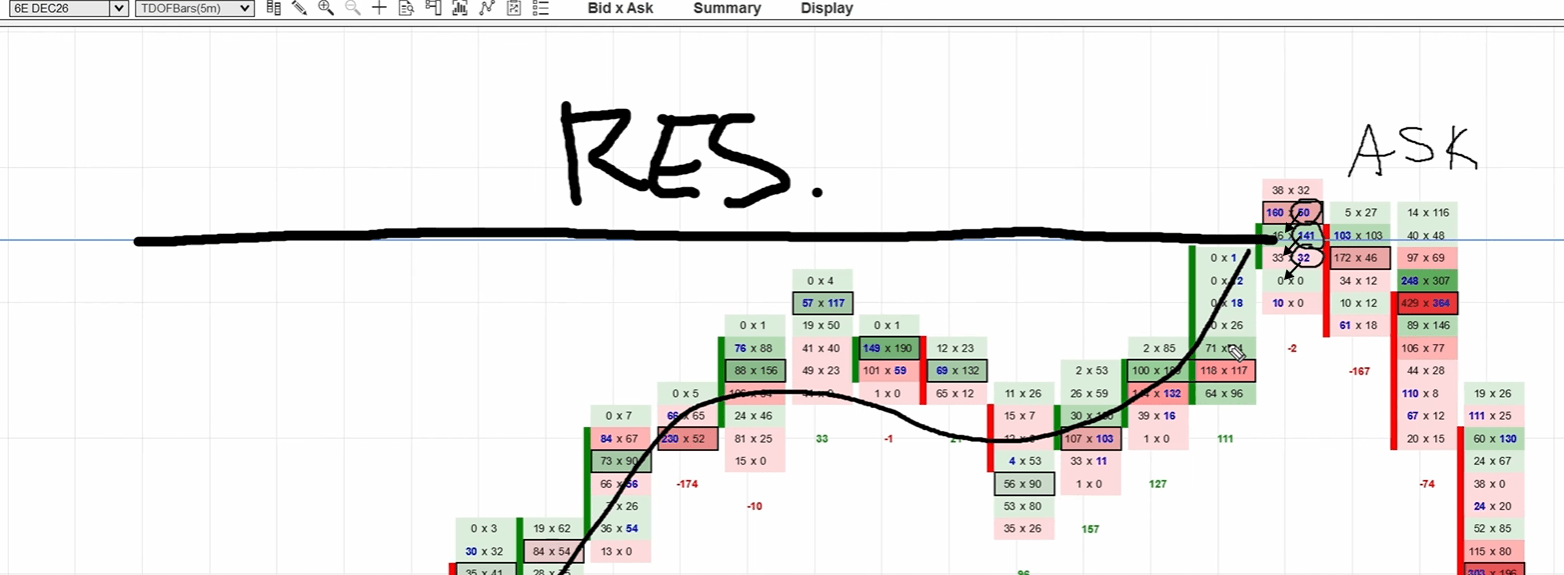
You always compare the numbers diagonally. You take the bid number on the left and compare it with the ask number one row higher on the right. Here are the real numbers from my trade:
Bid (Left) | Ask (Right, one row up) | Ratio | Imbalance? |
16 | 50 | About 3.1 times | Yes, buyers dominant |
33 | 141 | About 4.3 times | Yes, buyers dominant |
0 | 32 | Sellers absent | Yes, buyers dominant |
All three are on the ask side. That means buyers were dominant in those three price levels. My software highlights these imbalances in blue, so I can spot them right away.
Why Stacked Imbalances Near the High Matter
One imbalance is not enough. You want them stacked, meaning one on top of the other. In my trade, there were three in a row. You also want them very close to the high of the candle.
Why does this matter? Stacked imbalances near the high show a strong, focused push by buyers. They were buying hard right at the top. When the price then drops, these buyers are hurt the most. That is what makes them truly trapped.
What Delta Tells You
Delta is the difference between buying and selling volume in a candle. Positive delta means more aggressive buying. Negative delta means more aggressive selling.
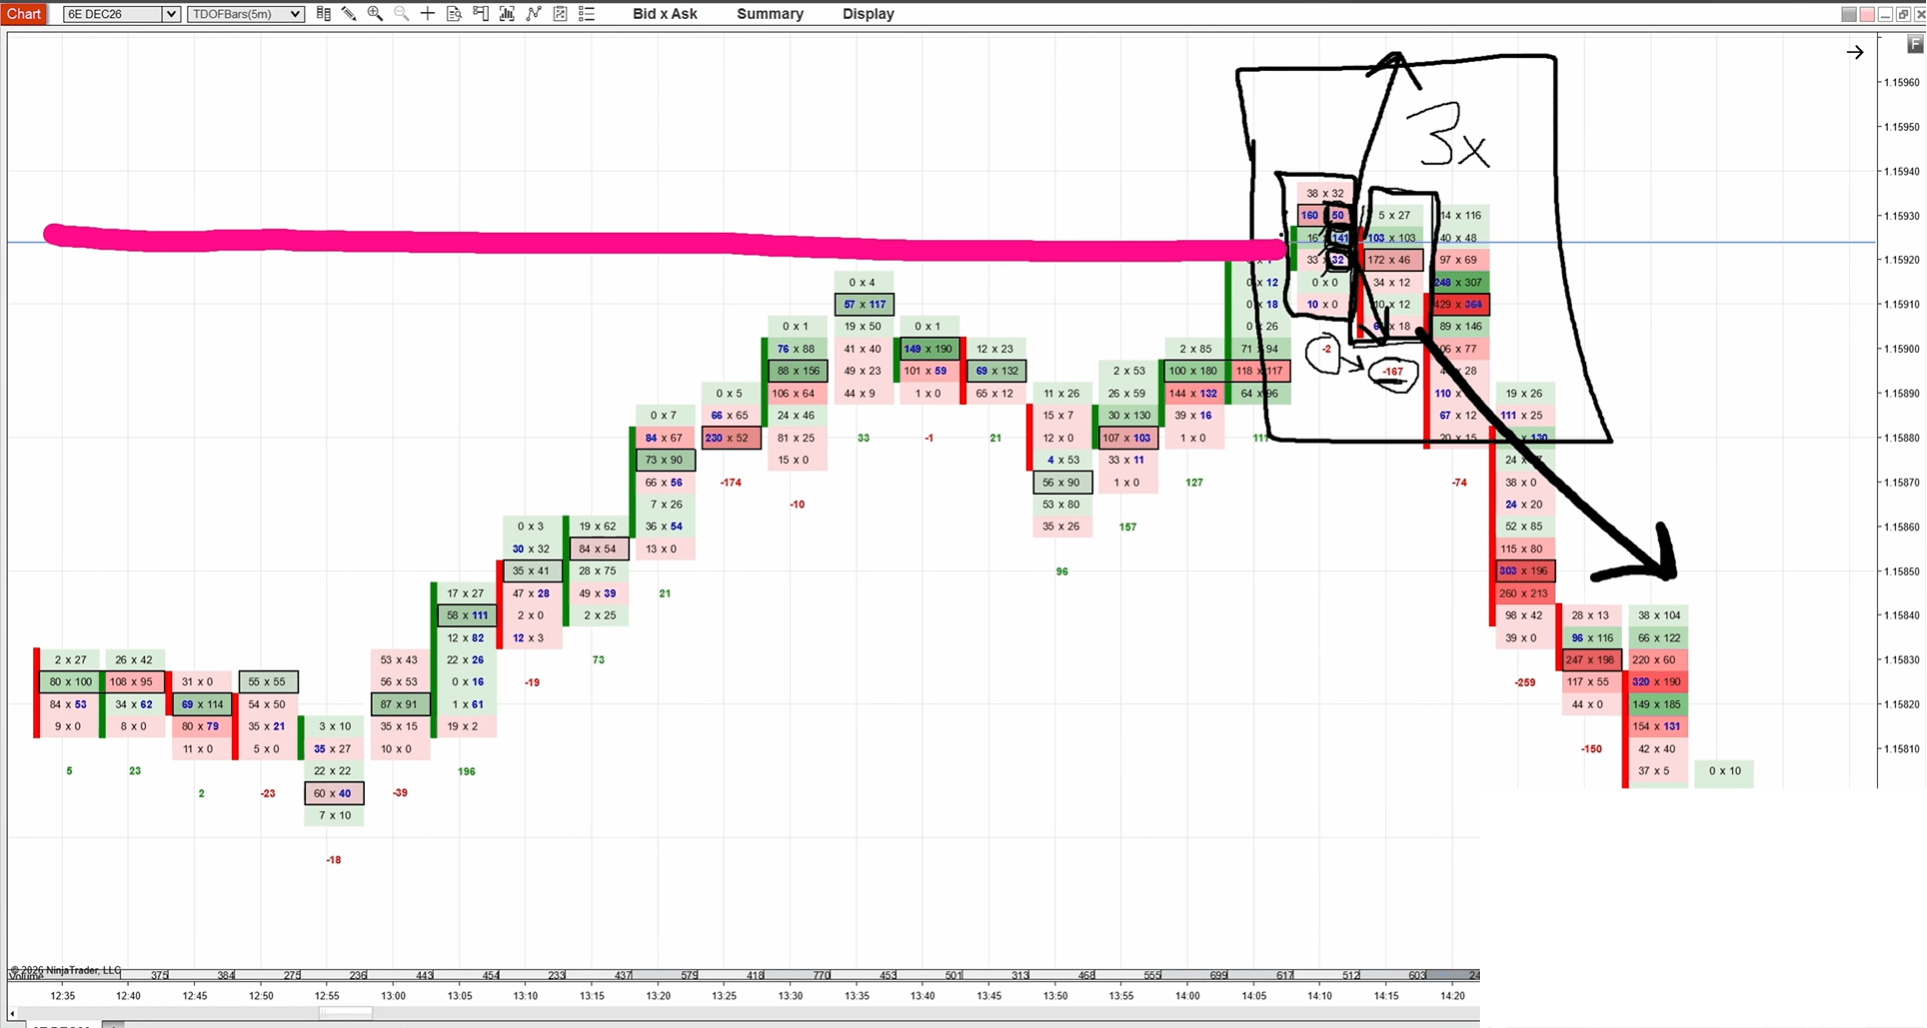
In a good trapped traders setup, the delta usually flips. In my trade, the candle with the imbalances had delta around zero. The next candle had strongly negative delta. That showed strong sellers jumping in. When the price turns, the delta should turn as well.
A Real Order Flow Trapped Traders Trade on Euro Futures
Now let us look at a real trade. This is a trade I took on Euro futures. I also called it in advance for members of my trading course. All the charts come from NinjaTrader 8.
I will break it down into three simple steps, from the big picture to the entry.
Step 1: Finding the Level on the 30 Minute Chart
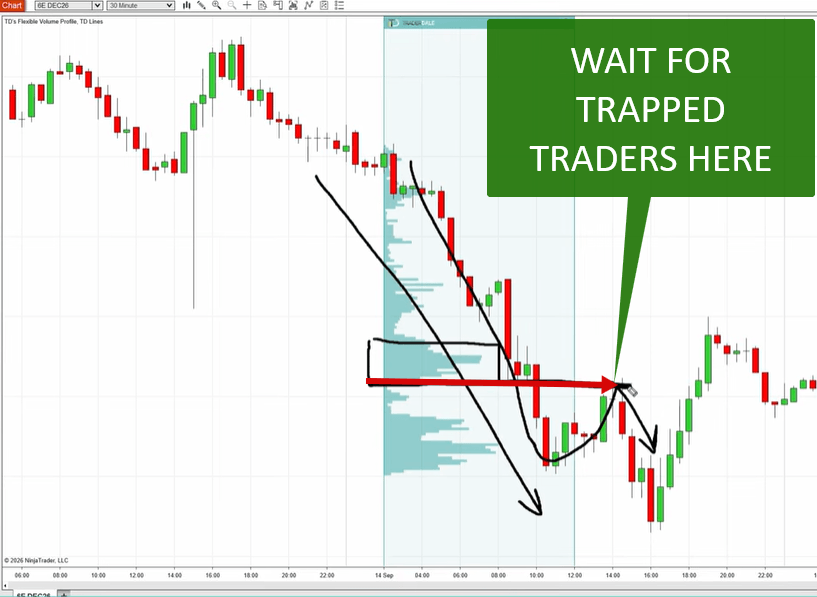
On the 30 minute chart, the price was in a downtrend. When the price is falling, I look for significant volume clusters inside that trend. One cluster stood out clearly. It was strong, and it caught my eye right away.
My plan was simple. I would wait for a pullback up into that cluster. Then I would look to sell from the beginning of the cluster. That became my resistance level.
Step 2: Checking the Level on the 30 Minute Order Flow Chart
Next, I switched to the 30 minute Order Flow chart. Here, the heavy volume zone was easy to see. The cells were in darker shades of gray, which means heavier than normal volume was traded there.
There was one more detail. The high volume nodes in three footprints sat at the same price. My software highlights them in yellow when this happens. When several high volume nodes line up at one price, it confirms a strong level.
I did not trade from the exact level, though. My preference is to trade from the beginning of the heavy volume zone. I marked that with a blue line. The price came up in a pullback and touched that line.
Step 3: Spotting the Trapped Buyers on the 5 Minute Footprint
For the entry, I switched to the 5 minute bid x ask footprint chart. The price rose toward my resistance. I waited for confirmation.
Then it came. A candle printed three stacked imbalances at the ask, right near its high. This screamed that buyers were in charge. But the next candle did not go up. It closed lower, with strongly negative delta.
Those buyers were trapped. When that candle closed, I had my confirmation and entered short. Buyers tried to break through. They failed. Sellers took over.
Common Mistakes With the Trapped Traders Setup
Knowing the setup is one thing. Avoiding the common traps yourself is another. Here are the mistakes I see most often, and how to fix each one. Read them slowly and check your own past trades against this list.
Mistakes to Watch For
- Trading it anywhere on the chart. This is the biggest one. Without a strong level, the signal is just noise. Always find your zone first.
- Entering before the candle closes. The heavy buying alone is not the signal. You need to see the failure. Wait for the next candle to close lower (for shorts) or higher (for longs).
- Ignoring where the imbalances sit. For a short, the imbalances should be close to the high of the candle. If they sit in the middle or near the low, the story is weaker.
- Accepting a single imbalance. One imbalance can happen by chance. Stacked imbalances show a real, focused push.
- Forgetting the delta. If the price turns but the delta does not, be careful. A delta flip adds strength to the signal.
- Treating it as a full strategy. Trapped traders are a confirmation tool. The level comes first. The trapped traders come second.
A Simple Checklist Before You Enter
Use this checklist every time. If you cannot tick every box, skip the trade.
Check | Short Trade | Long Trade |
Strong zone marked in advance? | Resistance | Support |
Price has reached the zone? | Yes | Yes |
Stacked imbalances present? | At the ask | At the bid |
Imbalances near the extreme? | Near the high | Near the low |
Next candle closed against them? | Closed lower | Closed higher |
Delta flipped? | Negative | Positive |
This simple routine keeps you patient. It also stops you from chasing random signals. If you want to see how other footprint signals fit in, check my article on [order flow volume absorption] (internal link).
Conclusion
Order flow trapped traders give you a clear way to confirm trades at key levels. The concept is simple once you see it. Aggressive traders push hard in one direction. The price refuses to follow. Those traders are stuck, and the other side takes control.
Let us review the most important points. First, the setup only works at a strong support or resistance zone. I like to find these zones with Volume Profile, but you can use any tool you trust. Second, look for stacked imbalances close to the high for shorts, or close to the low for longs. Third, wait for the next candle to close against those traders. A delta flip adds even more confidence.
In my Euro futures trade, all these pieces came together. The volume cluster gave me the level. Next, the 30 minute Order Flow chart confirmed its strength. Finally, the 5 minute footprint showed three stacked imbalances at the ask, followed by a bearish candle with negative delta. That was my signal to go short.
Remember that this is a confirmation, not a stand alone strategy. The level always comes first. Practice spotting trapped buyers and trapped sellers on your own charts. Start by marking strong zones, then watch how the footprint behaves when the price arrives. With time, you will recognize these moments much faster. That patience is what makes this setup useful.
FAQ
What are trapped traders in order flow?
Trapped traders are aggressive buyers or sellers who push hard but fail to move the price. For example, buyers place heavy orders at the ask near a high, but the price drops instead. Their failure shows that the other side is stronger.
Where should I look for the trapped traders setup?
Only look for it at strong support or resistance zones. You can find these with Volume Profile, Smart Money Concepts, Fibonacci, or old swing levels. Away from a strong level, the signal is just noise.
What is a footprint imbalance?
An imbalance appears when one side is three times or more stronger than the other. You compare the bid and ask numbers diagonally. Stacked imbalances near a candle extreme are a key part of this setup.
Learn the Full Order Flow Strategy
If you want to learn my complete Order Flow strategy from A to Z, I can help. You will also get access to my custom made Order Flow tools, including the indicators you saw in this article. Visit trader-dale.com and click Trading Course and Tools. It will take you straight to the page with my Order Flow course and indicators.
