If you have ever felt like the market knows exactly where your stop loss is, you are not alone. Most retail traders use “lagging” indicators—things like RSI, MACD, or Moving Averages. These tools tell you what happened in the past, but they don’t tell you what the “Big Players” are doing right now. To truly understand how to trade using Volume Profile and Order Flow, you have to stop looking at price patterns and start looking at the money.
The financial markets are not a random walk. They are moved by massive institutions: central banks, hedge funds, and investment firms. These entities trade such huge amounts of money that they cannot enter the market all at once without moving the price against themselves. Because of this, they leave “footprints” in the form of volume.
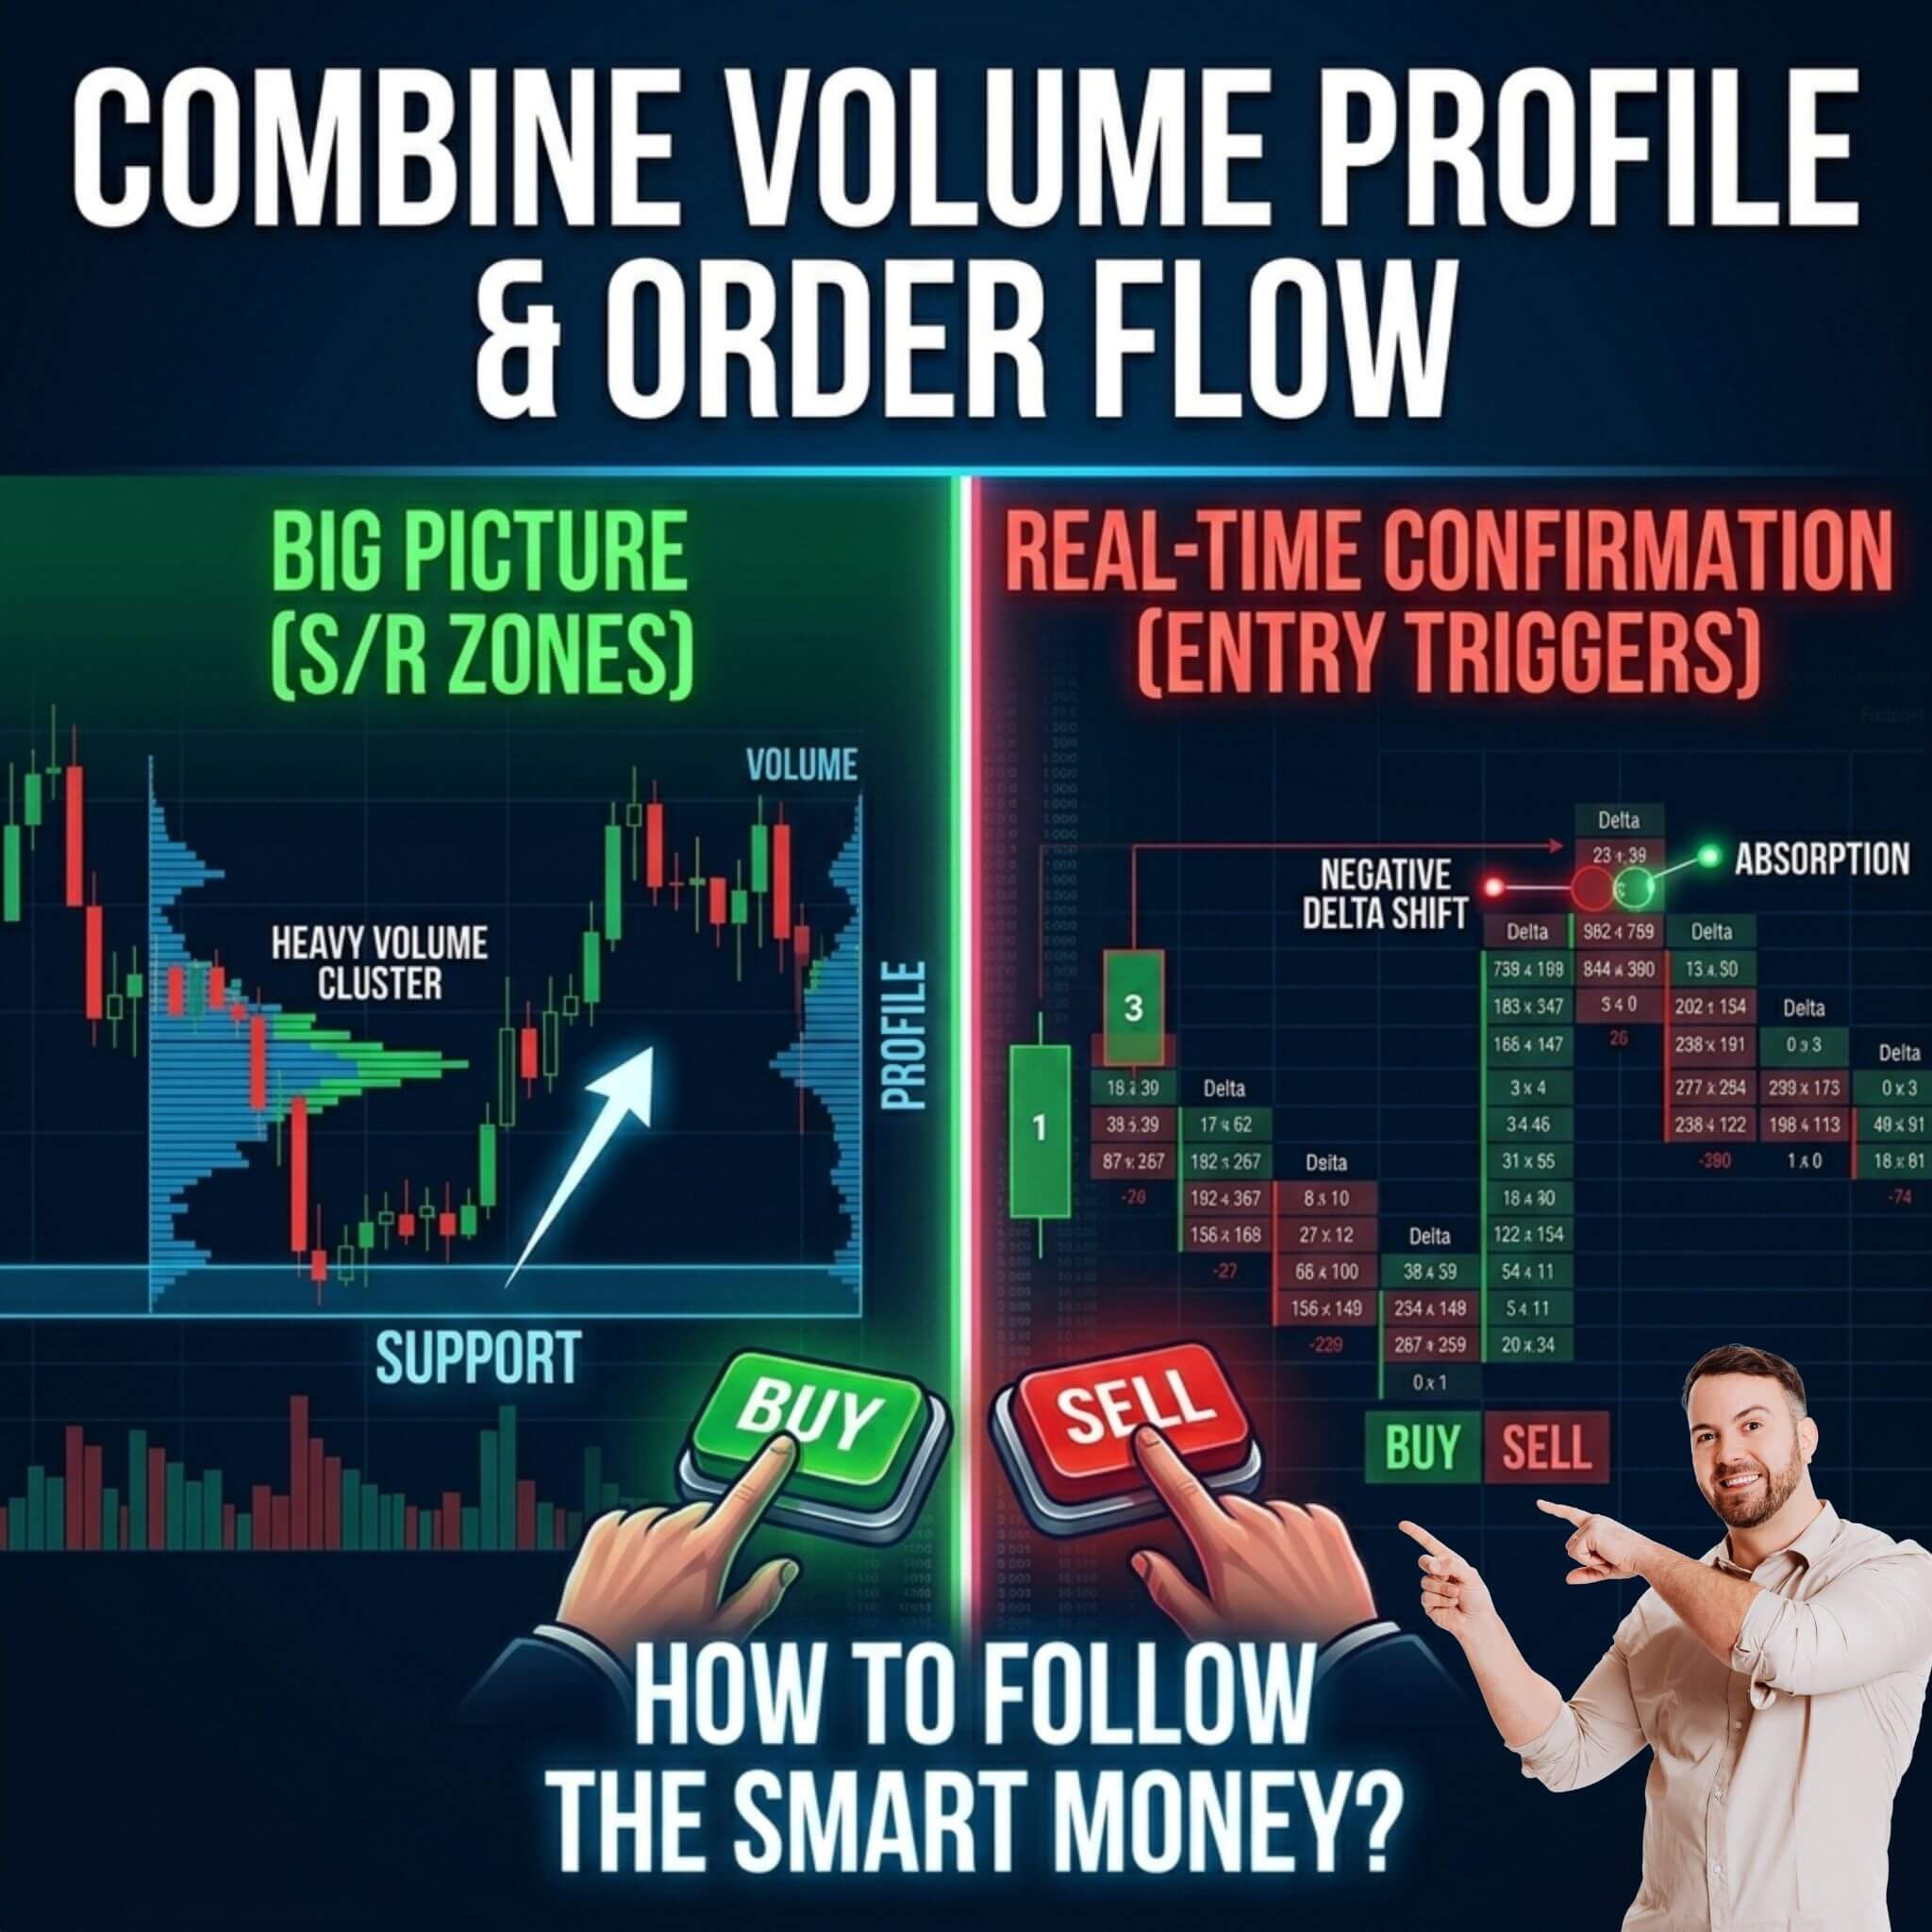
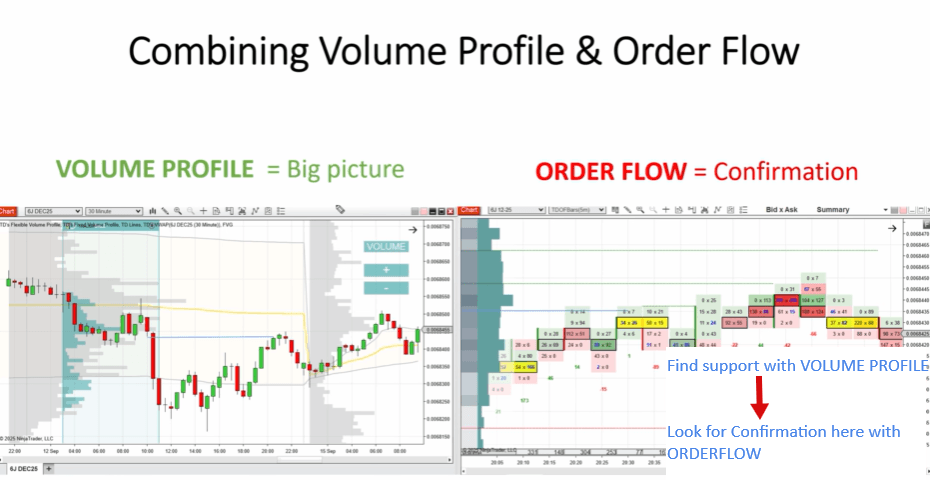
In this comprehensive guide, I draw on over a decade of professional trading experience to show you a two-step system. First, we use the Volume Profile to map out the “big picture”—identifying exactly where these institutions are accumulating their positions. Second, we use Order Flow to look at the “micro” details, confirming that those same players are active and defending their zones before we ever place a trade. This strategy isn’t about “guessing” or “gambging.” it is about following the smartest money in the room with surgical precision.
By the end of this article, you will understand how to identify high-probability support and resistance zones, how to read the “Delta” of a market, and how to spot “Absorption”—the secret weapon of institutional buyers. Let’s dive into the mechanics of professional trading.
Table of Contents
5 Key Takeaways
Volume Profile identifies “Heavy Volume Zones” where institutions have a vested interest.
Support and Resistance are areas of high activity (rotations), not just single price lines.
Order Flow acts as the confirmation trigger, showing real-time aggressive buying or selling.
The First Test is your best friend—it offers the highest probability of a successful bounce.
Delta and Absorption are the two primary metrics that tell you if a level will hold or fail.
1. What is the Strategy for Trading Volume Profile and Order Flow?
To master how to trade using Volume Profile and Order Flow, you must first change how you view a chart. A standard candlestick chart only shows you where the price went. It doesn’t tell you how much effort (volume) it took to get there. Imagine two cars driving up a hill: one is a lightweight sports car, and the other is a heavy truck carrying 10 tons. Even if they are moving at the same speed, the truck has much more “momentum” and “force.” In trading, Volume is that force.
The Volume Profile is a tool that shows you how much volume was traded at a specific price level over a certain period. While most volume indicators sit at the bottom of your chart (vertical volume), the Volume Profile sits on the side (horizontal volume). This allows you to see exactly which price levels are the most important to the big players.
Order Flow, on the other hand, is like a microscopic look at a single candlestick. It shows you the “bid” and “ask” prices—the literal battle between buyers and sellers happening every second. By combining these two, we eliminate the guesswork.
We use Volume Profile to find a “Level of Interest.”
We wait for price to reach that level.
We use Order Flow to see if the “Big Players” are actually reacting.
If you have a resistance level but the Order Flow shows buyers are still extremely aggressive and no sellers are pushing back, you don’t take the trade. This “Confirmation Filter” is what separates professional traders from those who lose their accounts. You are essentially waiting for the market to prove you right before you risk a single dollar.
2. Finding Institutional Support and Resistance Zones
The foundation of knowing how to trade using Volume Profile and Order Flow is identifying where the “Smart Money” is active. These players do not trade like you or me; they can’t just click a button and enter 5,000 contracts. If they did, the price would jump 50 points instantly, and they would get a terrible entry price. Instead, they accumulate their positions during “Rotations.”
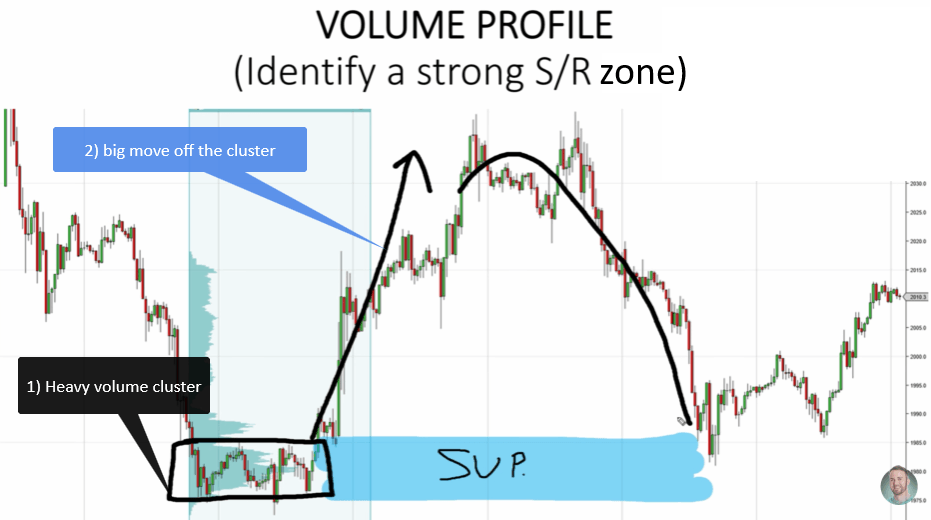
A rotation is when the price moves sideways in a relatively tight range. During this time, the big players are slowly buying or selling. On your Volume Profile, this looks like a large “belly” or a “Heavy Volume Zone” (HVZ). These zones are the most important areas on your chart.
Support Zones: If price spends time in a rotation and then aggressively breaks out to the upside, that heavy volume zone is now a Support. The buyers who built that position will want to defend it if the price ever comes back.
Resistance Zones: If price spends time in a rotation and then aggressively breaks out to the downside, that zone is now a Resistance. The sellers will want to keep the price below that level to stay in profit.
I prefer to use a 30-minute time frame to find these zones. Why? Because it is fast enough to give us several opportunities a week, but slow enough to filter out the “noise” of high-frequency trading bots. When you look at a 30-minute chart, you can clearly see the “clusters” of volume. Your job is to draw a box around these clusters and wait. Patience is the most profitable skill in trading. You aren’t chasing the price; you are setting a trap and waiting for the price to walk into it.
3. The Golden Rule: Trading the First Test
If you want to survive in this business, you must learn the “First Test” rule. When learning how to trade using Volume Profile and Order Flow, many beginners get excited when they find a strong level. They try to trade that level every time the price touches it. This is a massive mistake.
The First Test is the very first time price returns to a Heavy Volume Zone after the initial breakout. This is when the level is at its strongest. The institutional players still have “resting orders” at these levels. They are waiting to protect their positions. Usually, the first time the price hits the zone, you get a sharp, fast reaction. This is where the easy money is made.
The more times a level is “tested,” the weaker it becomes. Think of it like a frozen lake. The first person to walk on the ice (the first test) might find it very solid. But as more and more people walk over that same spot, the ice begins to crack. Eventually, the ice breaks, and people fall through. In trading, we call this a “Breakout.”
If you see a Support level that has already been touched two or three times, ignore it. The big players have likely already filled their orders, and there is no one left to defend the level. By sticking strictly to the First Test, you significantly increase your “Win Rate” and decrease your frustration. You only want to trade when the odds are heavily stacked in your favor.
4. Mastering Order Flow: The Power of Delta
Now we move into the “Micro” part of how to trade using Volume Profile and Order Flow. Once the price enters your pre-defined Support or Resistance zone, you open your Order Flow software. The most important metric to watch here is Delta.
Delta is a simple math equation: Aggressive Buyers minus Aggressive Sellers.
Aggressive Buyers: People buying at the “Market” price on the Ask side.
Aggressive Sellers: People selling at the “Market” price on the Bid side.
Imagine the price is falling into your Support zone. You are looking for a reason to buy. On your Order Flow chart, you see the Delta. If the Delta has been negative (more sellers) but suddenly turns strongly positive as soon as it hits your zone, what does that tell you? It tells you that the buyers have arrived! They are now more aggressive than the sellers.
This is your “Trigger.” You don’t need to be a math genius to read this. You just need to look for a shift in power. If price hits your resistance zone and the Delta stays positive, it means buyers are still charging up the hill. Do not sell! Wait for the Delta to turn negative, showing that the “Big Sellers” are actually pushing the price back down. This single technique will save you from hundreds of “Stop Outs” throughout your trading career.


5. Spotting Absorption: How Institutions Trap Traders
One of the most powerful concepts in professional trading is Absorption. This is the ultimate “secret” of how to trade using Volume Profile and Order Flow. Absorption occurs when one side of the market is very aggressive, but the price refuses to move.
Let’s look at a “Short” scenario:
Price hits your Volume Profile Resistance Zone.
On the Order Flow, you see a massive amount of buying volume. The numbers on the “Ask” side are huge—maybe 5 or 10 times higher than usual.
Despite all this buying, the price does not move higher. It “stalls” at the level.
What is happening? A “Big Player” (a seller) has placed a massive limit order at that price. Every time a retail trader buys, the big player “absorbs” that buy with their sell order. They are essentially a brick wall. The aggressive buyers are exhausted because they can’t push the price any higher. Once the buyers give up, the price collapses.
When you see “High Volume Nodes” (unusually large numbers on both sides of the footprint) inside your zone, and the price isn’t breaking through, that is Absorption. It is a signal that a massive institutional player is sitting there, catching every order. This is often the start of a very large market reversal. If you can spot absorption, you are trading alongside the biggest banks in the world.

6. Step-by-Step Execution: Putting It All Together
To make sure you truly know how to trade using Volume Profile and Order Flow, let’s break the entire process down into a simple checklist you can use every day.
Preparation: Open your 30-minute chart. Use the Volume Profile (Fixed Range or Session Volume) to identify the “Heavy Volume Zones” from recent rotations.
Mapping: Draw your Support and Resistance zones based on these volume peaks.
The Wait: Wait for the price to return to the zone. Remember: First Test Only!
The Switch: As price enters the zone, switch your eyes to the Order Flow chart.
Confirmation: Look for a Delta Shift (e.g., negative to positive at support) or Absorption (high volume nodes with no price movement).
Entry: Place your trade once the confirmation appears.
Stop Loss: Place your stop loss behind the Heavy Volume Zone or behind the “Absorption” candle.
Exit: Take profits at the next high-volume area or a logical technical level.
This systematic approach removes the emotional “fear of missing out” (FOMO). If the price doesn’t hit your zone, you don’t trade. If the price hits your zone but the Order Flow doesn’t confirm it, you don’t trade. You are only trading when everything aligns perfectly.
Conclusion: Take Your Trading to the Next Level
Mastering how to trade using Volume Profile and Order Flow is a journey, not a sprint. It takes time to train your eyes to see the rotations and your mind to wait for the confirmation. But once you stop looking at lagging indicators and start looking at the actual volume and intent of the market, everything changes. You stop being a “victim” of the market and start being a hunter.
FAQ: Common Questions
1. Is Order Flow better than Volume Profile? Neither is “better.” They serve different purposes. Volume Profile is your map (strategy), and Order Flow is your compass (execution). You need both to be successful.
2. Can I use this for Crypto or Stocks? Yes! This strategy works on any market that has centralized volume data, such as Futures (ES, NQ, Gold, Oil) or highly liquid Stocks and Crypto.
3. What software do I need? You need a platform that supports Volume Profile and Footprint charts. Many professional traders use platforms like Sierra Chart, NinjaTrader, or specialized Order Flow plugins.
What is left to do:
Ready to stop guessing and start trading with institutional precision? Head over to trader-dale.com to explore my custom Volume Profile and Order Flow tools. I offer specialized training packs that include the same indicators I use in my daily trading. Whether you want to master the “big picture” or dive deep into the footprints, I have the resources to help you succeed.