Hello my friends!
Today I would like to tell you something about my way of using price action. Let me start with a question: What comes to your mind when you hear the term “price action“? I think that lot of people’s idea is that price action = candlestick patterns. In my point of view price action isn’t hunting for pinbars, inside bars, outside bars, engulfing bars etc. The truth is that big market players who move the markets (institutions, banks, …) don‘t really care if there is engulfing bar on M30 chart or pinbar on H1 chart.
To really understand price action you need to know what makes the price move. Somebody may think that the price moves because there are more buyers than sellers or vice versa. I sometimes hear this opinion in television or read in press so don’t feel ashamed if you also thought that is the reason. What really makes the price move is aggression. If buyers are more aggressive then sellers, the price moves up. If sellers are more aggressive the price goes down.
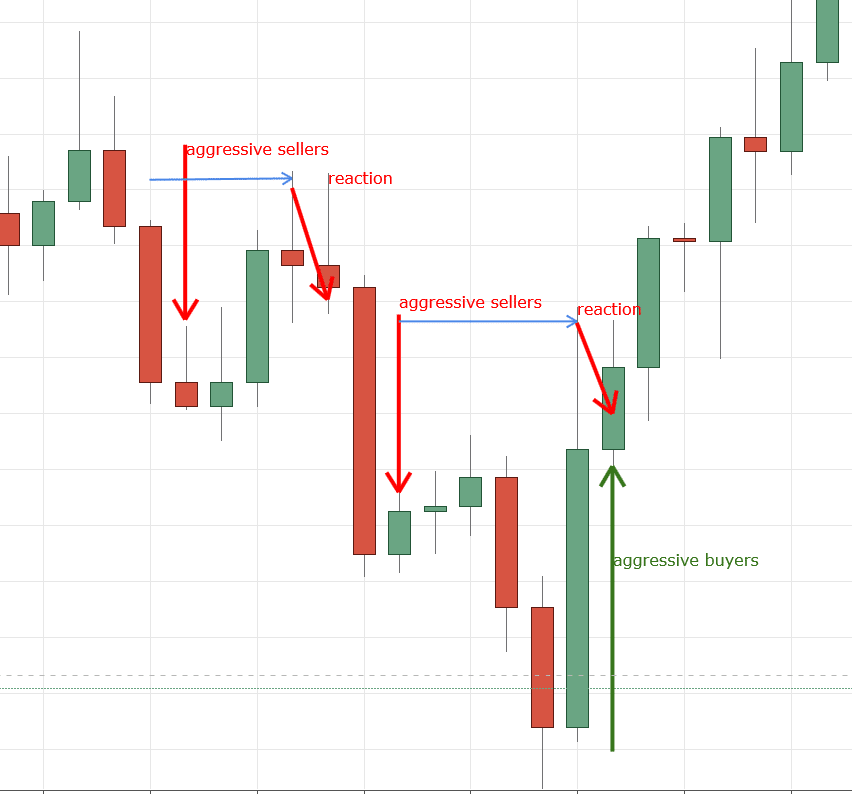
What I look for in my charts are places with apparent aggression. Those are the reference points I need to read price action. Have a look at an example:
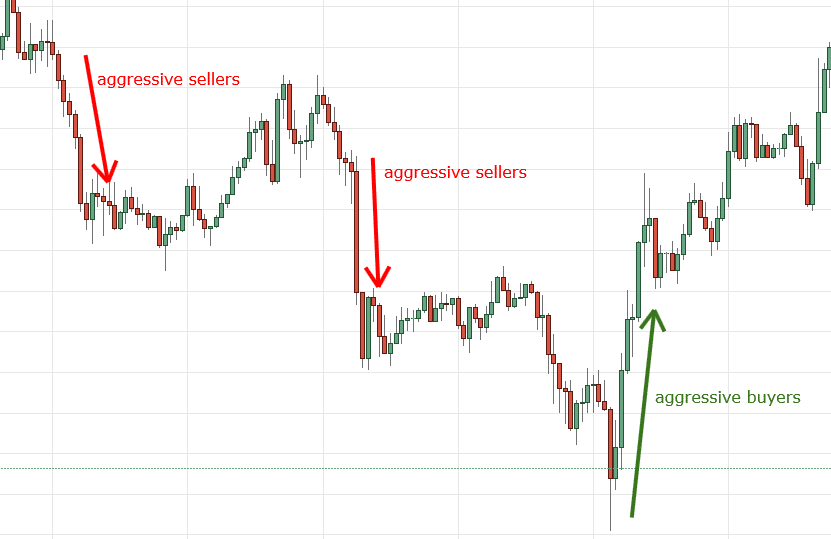
In the picture you can see three reference points. They give me a rough idea of what is going on in the chart and where aggressive players are. I suggest that you go through some charts and look for aggressive buyers/sellers yourselves so you can have some practical experience with this.
In my trading I look for places where the aggression started (iniciation of aggression). When price reaches those places again it is very probable that aggressive players will become aggressive again (renewed aggressive activity) and there will be a reaction. Here is the same picture with reaction activity highlighted:
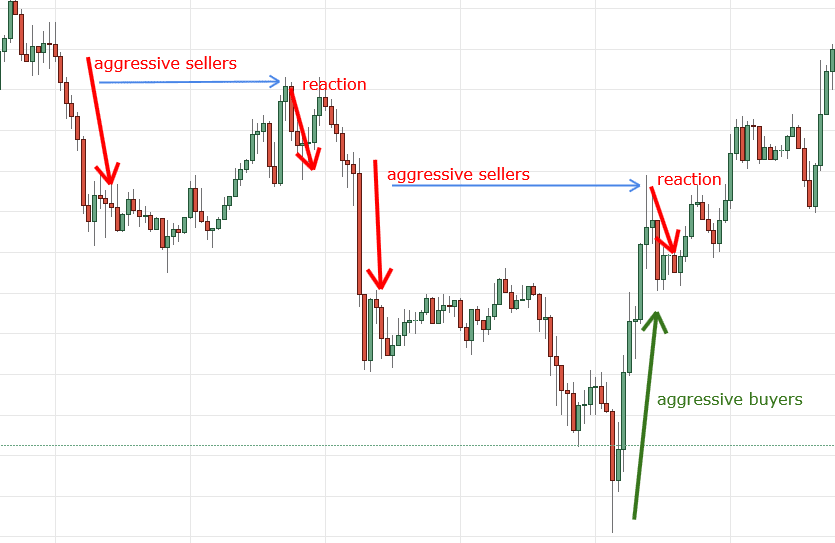
Apart from candlestic formations timeframe doesn’t really matter here. You can use whatever timeframe suits you best. Previous pictures were M30 timeframe. Look at the same chart in M5 and H4 timeframe.
M5:
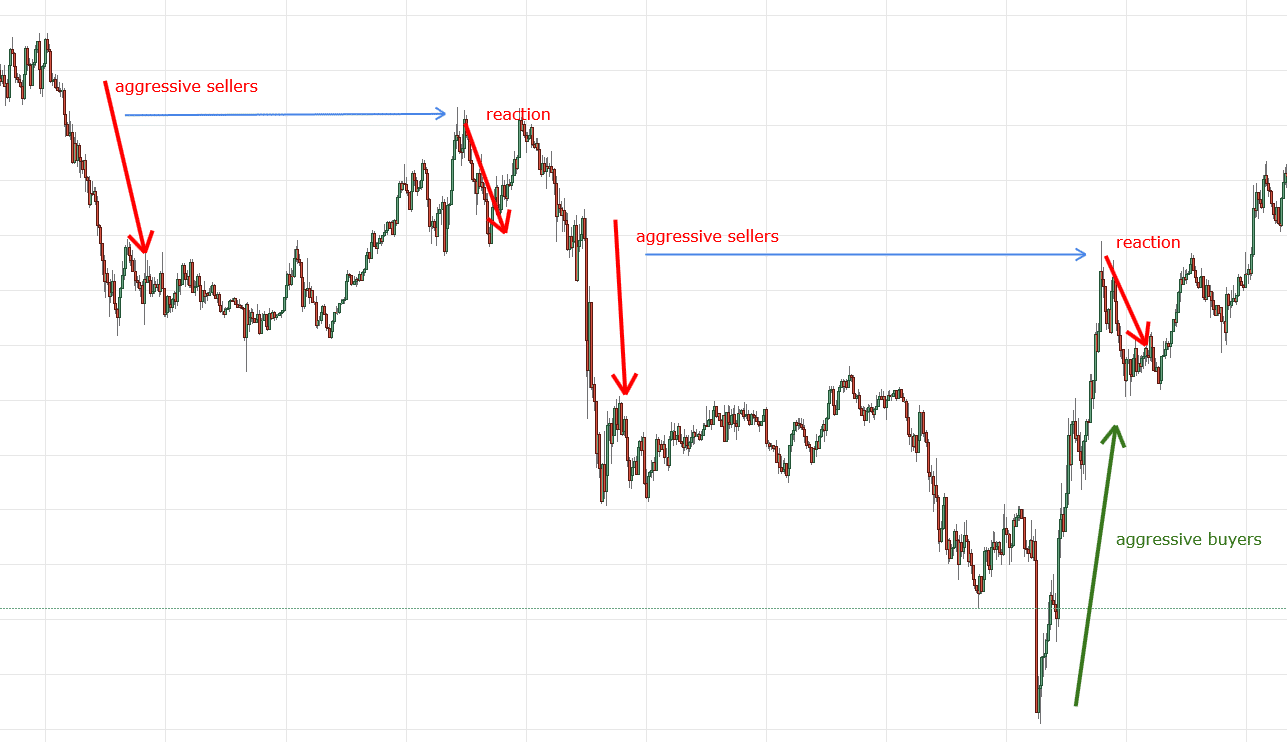
H4:
As you can see aggressive activity is apparent at all timeframes.
Now you should know that price is moved by aggressiveness which is visible in wide range of timeframes. You should be able to identify places where aggressive players were present. In the next article I will show you more in detail how to make your trading levels using these information.
Dale
on point