Hello my Friends!
In my article, Price Action – Aggression which you can read by clicking HERE, I was talking about aggressiveness in the market as well as why it is so critical to identify. Now I would like to tell you something about the highs and lows seen on a simple price chart. Forming of highs and lows is closely connected to the aggression of either buyers or sellers. With that in mind, if you didn’t read my previous article about aggression I recommend doing so, if you’re already caught up then let’s continue on!
Strong Highs/Lows
The most simple and widely known candle formation that shows aggressiveness is a Pinbar:
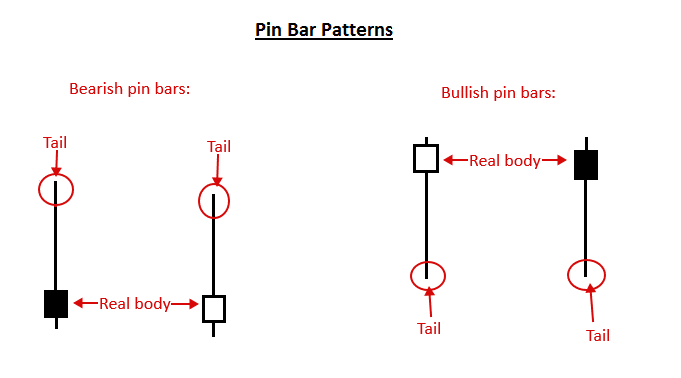
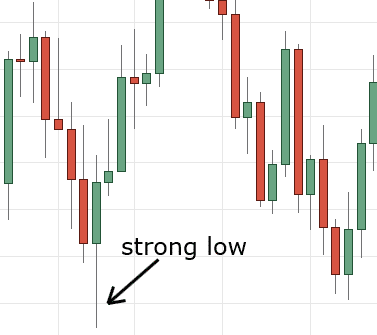
There are more candle formations like this and you don’t really need to know their names or definitions. The common thing for all of them is their long tail. The long tail means that there was a strong and aggressive reaction activity. Now this is exactly how you tell strong from weak highs/lows. If there is a swing low where you can see a strong and quick rejection of lower prices followed by an aggressive up-move you are looking at a strong low. Have a look at an example of a strong low:
It doesn’t really have to be a one-candle “formation”. With a little bit of practice, you can see aggressiveness for example here (strong high on M5 chart):
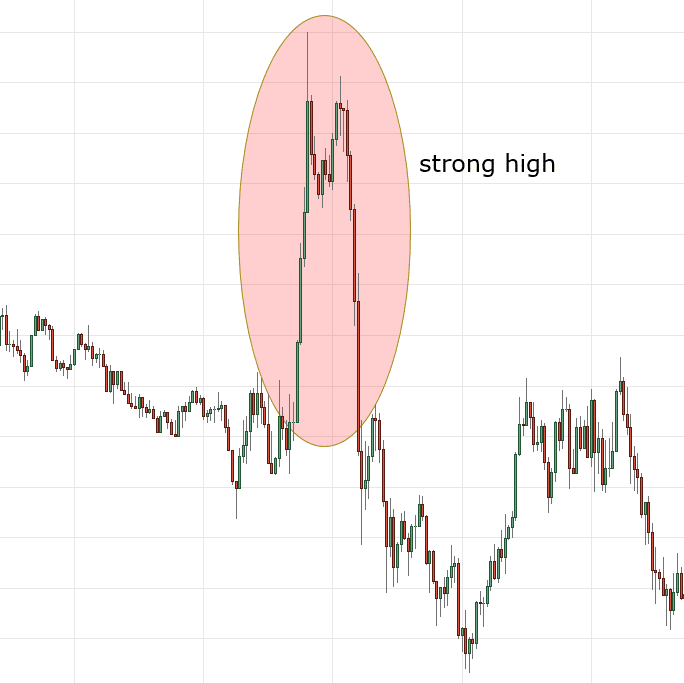
Remember – we are looking for aggression at highs/lows, not for candle formations! Candle formations can be different on every timeframe but strong highs/lows formed by aggressive players are usually visible across many timeframes.
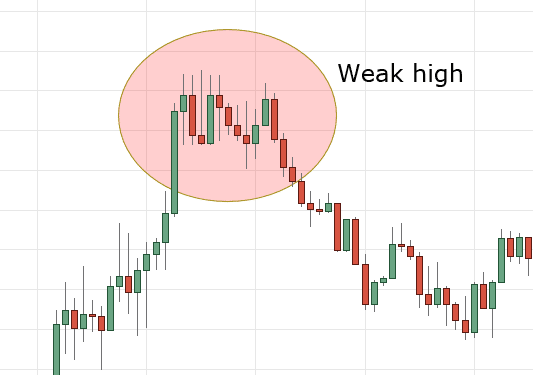
Weak highs/lows
Weak highs or lows are the exact opposite of strong ones. Again, using price action alone a weak high/low rather easily. They form slowly and there wasn’t any sort of strong/aggressive rejection.
Have a look at this example of a weak high:
How to Implement This into Trading:
Now you know the difference between strong and weak highs and lows. Strong highs/lows are very strong support/resistance zones as the aggressive buyers/sellers will likely reenter the market should the previous high/low be retested. On the contrary, weak highs/lows are places where aggressive buyers or sellers are few and far between, hence the tame rotation in price action.
I don’t really suggest you trade every strong high/low you see. I suggest that you are aware of strong/weak highs and lows in your trading and that you adapt accordingly.
For example – imagine you are in a long position and you see that the price is approaching an area where there were very aggressive sellers (strong high). You are aware of this so you quit your position before it reaches this area. You used knowledge of strong high to protect your profit and exit the trade. Here is an illustration:
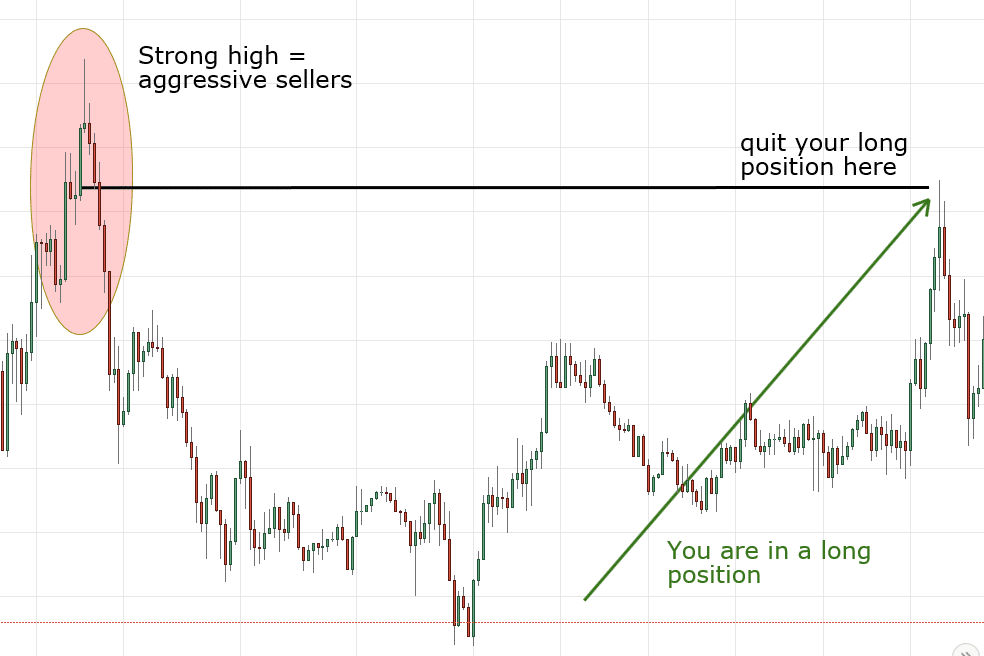
In the previous illustration, a weak high is also visible. Common mistakes would be: going short from there or quitting your long position early. Let me illustrate and remember – this is a BAD TRADE:

Summary:
Now you should be able to identify strong and weak highs and lows. You should always be aware of them in your trading and adjust your trading accordingly. Finally, you’ll notice this is a simple process. Simplicity is the key to repeatable results so don’t get lost trying to overcomplicate the process of identifying strong/weak highs/lows.
Happy Trading,
Dale
This is wonderful and a mistake I’ve frequently made. Just took Dalton’s primer course and he talks and talks and isn’t nearly as clear as this page. Thank you!
Thank you Chris, appreciate it! I’m always aiming to get straight to the point. 🙂
Dale, do you ever plan on developing a VP code for Tradingview?
Thank you
i love the way you explain the logic behind every trading concept that you teach, it shows that you always make in-depth researches before you publish or teach anything
Please your material is the best so how can get a soft copy?
Hello GEORGE
Thanks for liking!!
Please email me on contact@trader-dale.com to get my e-books copy!!
Price action