All eyes are now on EUR/USD!
Why? Because EUR/USD is by far the most traded currency pair and it is pretty near its 3-year low!
Let me now show you what I think about this development.
The BIG picture
The first important thing to notice is the big picture.
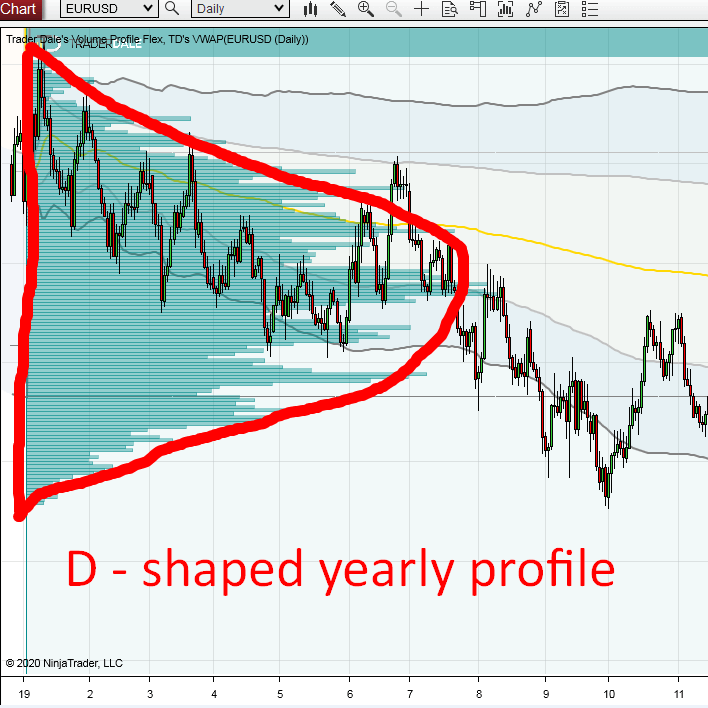
If you draw Volume Profile over the whole previous year 2019, then you can easily tell it is D-shaped.
A D-shaped profile tells us, that buyers and sellers are in a temporary balance.
So, 2019 was in balance and now the price gets very close to the low of previous year (heading outwards of the D profile).
In a case like that, it is more likely that the price will turn upwards and go back into the range of the D-shaped profile (back into the balance).
Why? Because around 70% of all the time, markets are balanced! I talk about this more in detail in my new Video Course.
EUR/USD, Daily chart:

Now, I am looking for some supports to go long from because I think EUR/USD is more likely to turn upwards again,
Best thing to do is to draw the Volume Profile over the price action area, where the price is heading now.
This means that in this case, I will draw the Volume Profile over the strong rejection of lower prices that occurred in November 2019. Because this is where the price is heading now.
I am looking for some significant Volume Cluster standing in the way (this would mean there is a volume-based support)
Do you want ME to help YOU with your trading?
The last volume-based support is breached
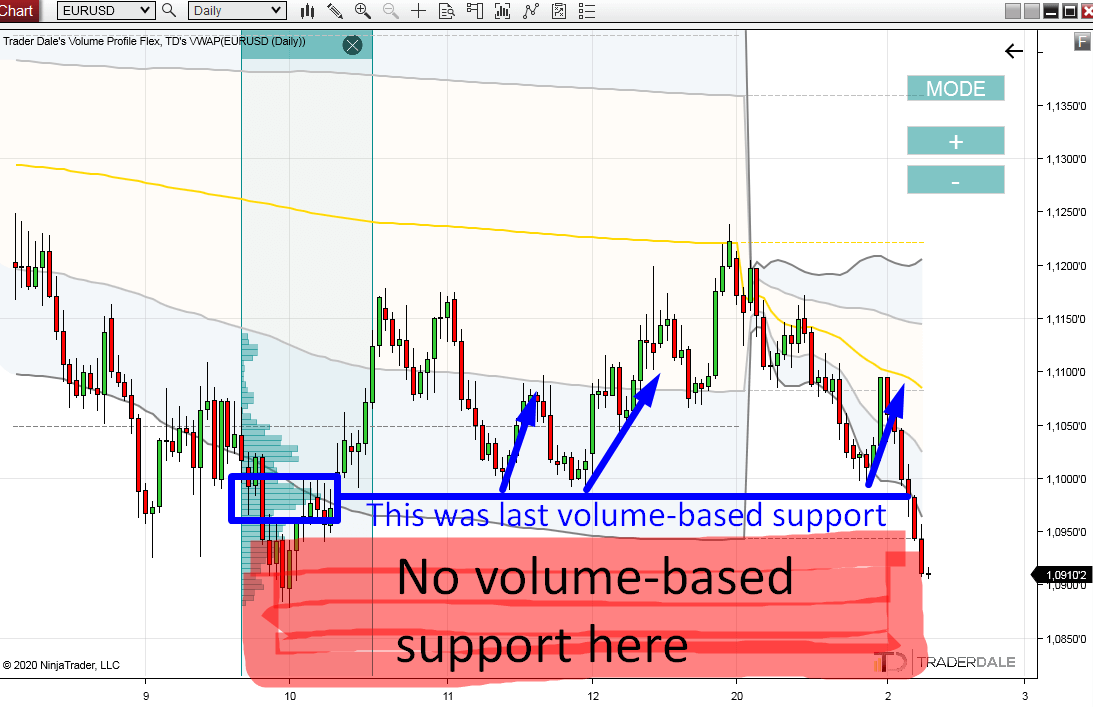
In this case, there is no Volume Cluster standing in the way!
The last one was around 1.0980. Price reacted to it several times, but then it got breached.
This means that now, no heavy volumes stay in the way!
This is important!
EUR/USD, Daily chart:
Does this mean that EUR/USD will drop?
Well, not necessarily.
AB = CD setup
There is one particular Price Action setup which I like to use and which often works like a charm. Especially on Daily time frame.
It is the AB = CD setup.
BTW I talk more about this setup more in this post from 4th February 2020:
AB = CD trading setup EXPLAINED
So, if you look on the Daily chart of EUR/USD, then you can notice a nice wave-like movement it did in the last +-30 days.
This wave-like movement created a very nice AB = CD formation.
EUR/USD, Daily chart:
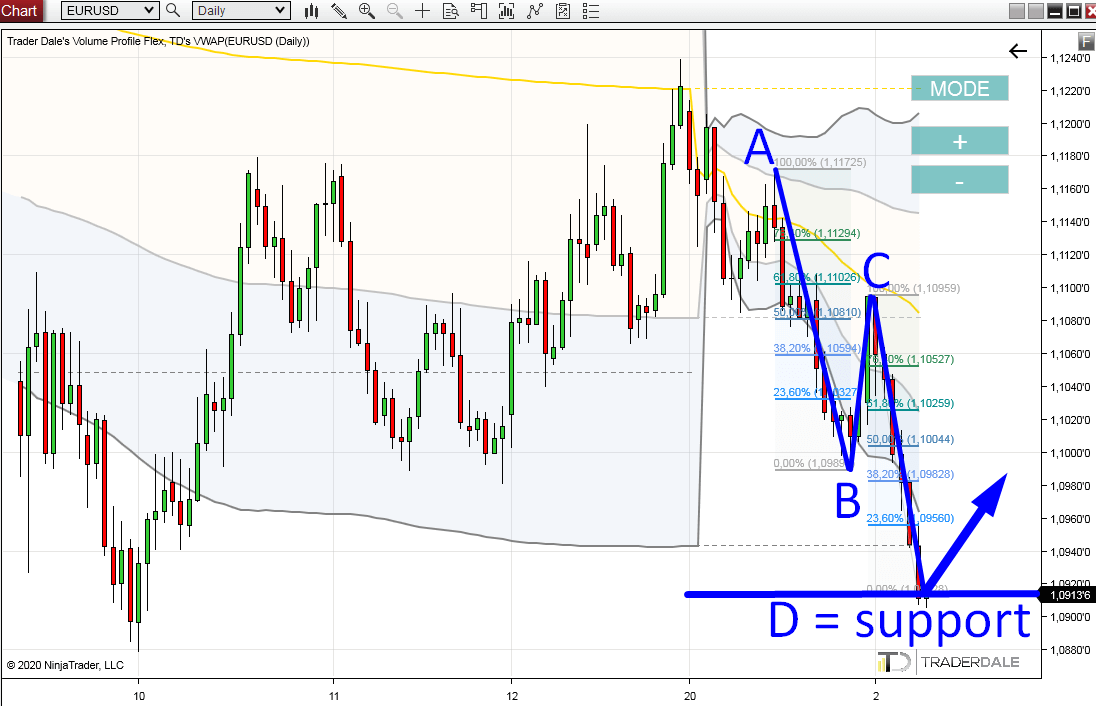
This formation shows the point D which is exactly where the price is RIGHT NOW (1.0913).
The point is that if the EUR/USD is to turn upwards, then according to my analysis it needs to happen NOW!
If not, then I expect to see another sell-off of hundreds of pips.
Happy trading!
-Dale