Do you want ME to help YOU with your trading?
Video Transcript:
Hello
everyone, it’s Dale here. In this video, I’m going to talk about rejections.
I’ll explain how to differentiate between a good trading opportunity and a
trap, and I’ll provide you with a checklist to help distinguish between a
promising trade and a risky one. I’ll also walk you through how I trade
rejections, step-by-step, so you can apply this strategy to your own trading.
Let’s
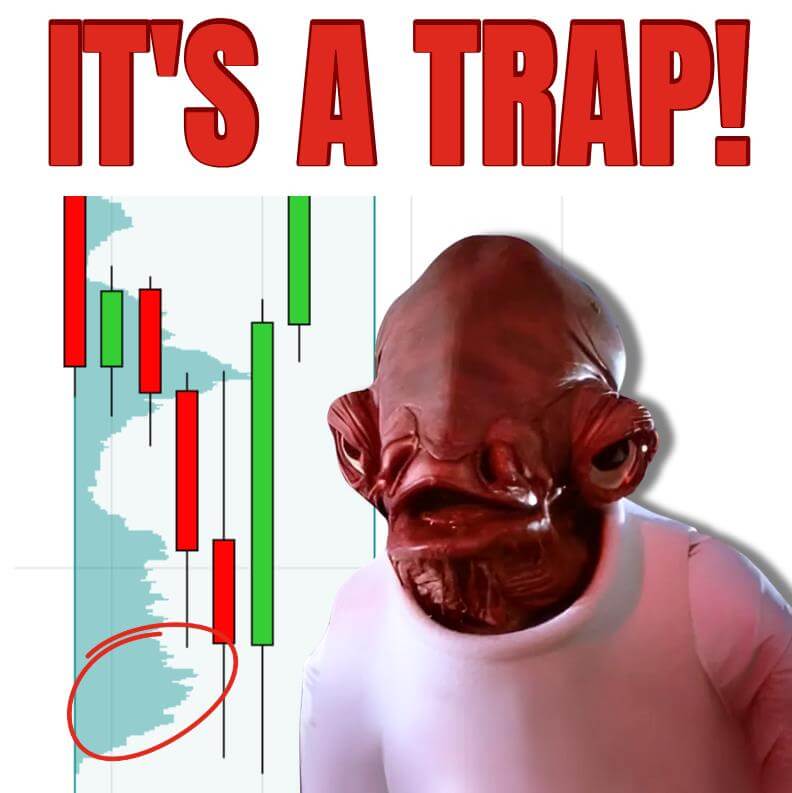
kick this off by looking at a chart. I have a question for you. Take a look at
this chart and tell me—what’s the first thing that stands out? I hope most of
you noticed this section of the chart: a strong rejection of lower prices. This
is what I refer to as a rejection. It occurs when the price moves aggressively
in one direction and then quickly reverses, moving just as aggressively in the
opposite direction. This video is going to focus entirely on rejections.
Rejections
are particularly significant because many traders base their trading decisions
around them. Regardless of the strategy they use, when a clear rejection
occurs, it becomes a focal point on the chart. It’s an area that can’t be
ignored, making it a crucial element for traders to consider.
However,
while many traders use these areas as support or resistance zones, they don’t
always work effectively. And that’s what I want to focus on in this
video—teaching you how to identify whether a rejection will act as a strong
support or resistance zone or whether it’s likely to be a trap where many
traders end up losing money.
Now,
let’s move on to the checklist that will help you identify whether a rejection
is a genuine trading opportunity or a trap.
The
first point on the checklist is market structure. You want to see that the
strong rejection formed when the market was in a rotation. If you use Volume
Profile, it should be D-shaped, like the capital letter D. But even without
Volume Profile, you can observe it visually. If the market is rotating, the
likelihood of a strong rejection functioning as a support or resistance zone is
higher. This is because when the market is rotating, the price tends to return
to the channel.
Let’s
say this is the center of the channel, with the high and low borders marked.
The price makes a rejection and typically moves back toward the center. This is
why you want to prioritize rejections that occur in rotational markets. So, the
first point on the checklist is that the market structure should be rotational.
The
second point is the strength of the rejection. I have two examples here—a
strong rejection and a weak rejection. A strong rejection has a clear turning
point—a sharp high or low. You can clearly see where the price turned and
quickly moved away from that point. It’s sharp, decisive, and aggressive.
Now,
look at the weak rejection example. The high is not well-defined. The market
tested the level multiple times without forming a strong turning point. This
indicates a lack of aggression from sellers or buyers. The second point on the
checklist is that the rejection should be strong, with a clear, aggressive
turning point.
The
third point is volume distribution. Ideally, you want to use a flexible Volume
Profile to look into the rejection zone specifically. In a strong rejection,
you’ll see a distinct volume cluster where heavy volumes were traded, followed
by a low-volume area. The heavy volume cluster indicates where buyers or
sellers aggressively entered the market.
Now,
look at the bad example. In this case, the heaviest volumes are right at the
low of the rejection. This is what I call a trap. It suggests that many traders
were willing to trade at the bottom of the rejection, which increases the
likelihood of the price revisiting that area to test liquidity. If you enter a
trade based on this rejection, there’s a high chance you’ll get stopped out as
the market retests that zone.
In
contrast, the ideal volume distribution is when the heavy volume zone is
followed by a low-volume area, indicating that few traders were willing to
trade there. This confirms that the price was aggressively pushed away from
that area, making it a stronger support or resistance zone.
The
fourth and final point on the checklist is the presence of a fair value gap. A fair
value gap is a concept from smart money trading. It occurs when the low of
the first candle and the high of the third candle do not overlap, creating a
gap. This gap signifies aggression in the market.
A
good rejection should ideally contain a fair value gap, as it indicates
aggressive buying or selling pressure. In the example I showed earlier, the
rejection has a fair value gap, confirming that sellers aggressively pushed the
price lower. However, in the weaker example, there’s no fair value gap,
indicating a lack of aggressive selling.
Now,
let’s recap the checklist.
1. The
market structure should be rotational.
2. The
rejection should be strong, with a clear turning point.
3. Volume
distribution should show a distinct heavy volume cluster followed by a
low-volume area.
4. A
fair value gap should be present, indicating market aggression.
If
all four conditions are met, the rejection is more likely to act as a strong
support or resistance zone. However, in trading, nothing is ever perfect. If at
least three of the four conditions are met, I still consider the rejection
valid and worth trading.
Now,
let’s apply this checklist to two trades.
First,
let’s look at this rejection. Is the market rotating? Yes, it is. Is the
rejection strong? Yes, there’s a sharp turning point. Are the volumes
distributed well? Yes, there’s a heavy volume zone followed by a low-volume
area. Is there a fair value gap? Yes, there is. All four conditions are met, so
this is a valid rejection.
How
do I trade it? I wait for the price to pull back to the heavy volume zone and
place a limit order at the beginning of that zone. My stop-loss is placed below
the low of the rejection, and my target is set at a minimum 1:1 risk-reward
ratio, but I aim for 1.5:1 when possible.
Now,
let’s look at another example, this time in a bullish scenario. We have a
rejection and the market is rotating. The rejection is strong, with a clear
turning point. The volumes are distributed well, but the fair value gap is
slightly higher than I would like. Still, three of the four conditions are met,
so I consider this a valid trade setup.
Again,
I place my limit order at the beginning of the heavy volume zone and set my
stop-loss below the low of the rejection. The target is set based on a
risk-reward ratio of at least 1:1.
Now,
if you want to learn more about how I trade rejections, Volume Profile, Order
Flow, or VWAP, head over to my website, trader-dale.com.
Click the “Trading
Course and Tools” button to see all the available educational packs,
including Volume Profile, Order Flow, VWAP, and Smart Money packs.
If
you’re interested in trading with me and other prop firm traders daily in a
live trading room, click the “FTA” button to
learn more about the Funded Trader Academy. You can book a call with us to
discuss whether the academy is right for you.
That’s it for today. I hope you found this video useful. I look forward to seeing you next time. Until then, happy trading!
What timeframe do you use for this analysis? Tks