Drawing on my years of experience navigating the volatile financial markets, I have seen countless traders abandon profitable systems far too soon simply because they didn’t understand the psychology of the equity curve. It is a heartbreaking cycle: a trader finds a proven method, starts with high hopes, but quits the moment the account balance dips, unaware that the dip was a perfectly normal part of the process. This guide is designed to break that cycle by teaching you how to distinguish between a broken strategy and a natural market phase.
In this comprehensive lesson, you will learn why the psychology of the equity curve is the real reason most traders fail and how to master your execution to ensure long-term success. We will explore the three primary ways an account behaves at the start and why your “start date” is often the biggest factor in your initial perception of success. By the end of this article, you will have a clear roadmap to stop “strategy hopping” and finally see the professional results you’ve been working toward. By shifting your focus from individual trade outcomes to the robustness of your total system, you can develop the mental toughness required to survive drawdowns and thrive during winning streaks. This is about more than just numbers; it is about reclaiming control over your trading career.
Table of Contents
Key Points
The “Start Date” Trap: Whether a strategy looks winning or losing often depends solely on when you began trading it.
Equity Curve Mastery: Most traders fail because they cannot handle the natural ups, downs, and sideways movements of their account balance.
Backtesting is Key: You must know your maximum drawdown and losing streaks before going live to avoid panic.
Execution Over Prediction: You cannot control the market, but you can control how perfectly you follow your own rules.
The 20-Trade Rule: Success is measured by following your plan for 20 trades, regardless of the financial outcome.
The Great Illusion: Why Same Strategies Look Different
One of the most eye-opening realizations a trader can have is that a “winning” strategy and a “losing” strategy can actually be the exact same system. This sounds like a contradiction, but it is the fundamental truth of the psychology of the equity curve. Imagine looking at a chart of a strategy’s performance over five years. It shows a beautiful, steady climb upward. However, if you zoom in on a specific three-month period within those five years, you might see a deep valley where the account lost 15% of its value.
If you happened to start trading on day one of those three months, your experience is one of constant loss. To you, the strategy is “broken.” But to the trader who started three years ago, this is just a small, expected dip in an otherwise amazing journey. This is why the psychology of the equity curve is so dangerous; it tricks your brain into thinking the current moment represents the permanent reality.

The "Start Date" Trap: Why Your First Trade Isn't Your Lasting Reality
Most people enter the market looking for a “holy grail” that never loses. When they experience a losing streak immediately after starting, they assume they were sold a lie. In reality, they simply started during a natural drawdown phase. Without the perspective of the “big picture,” it is nearly impossible to stay disciplined.
You must realize that you have zero control over the market environment when you begin. You might start during a “gold rush” or a “drought.” Understanding this removes the personal sting of early losses and helps you treat trading like a long-term business rather than a lottery ticket.
The Psychology of the Start: Three Equity Curve Scenarios
When you begin using a new approach, there are generally three ways your account balance (equity) will behave. Understanding the psychology of the equity curve in these scenarios is vital because each one offers a unique trap for the undisciplined trader.
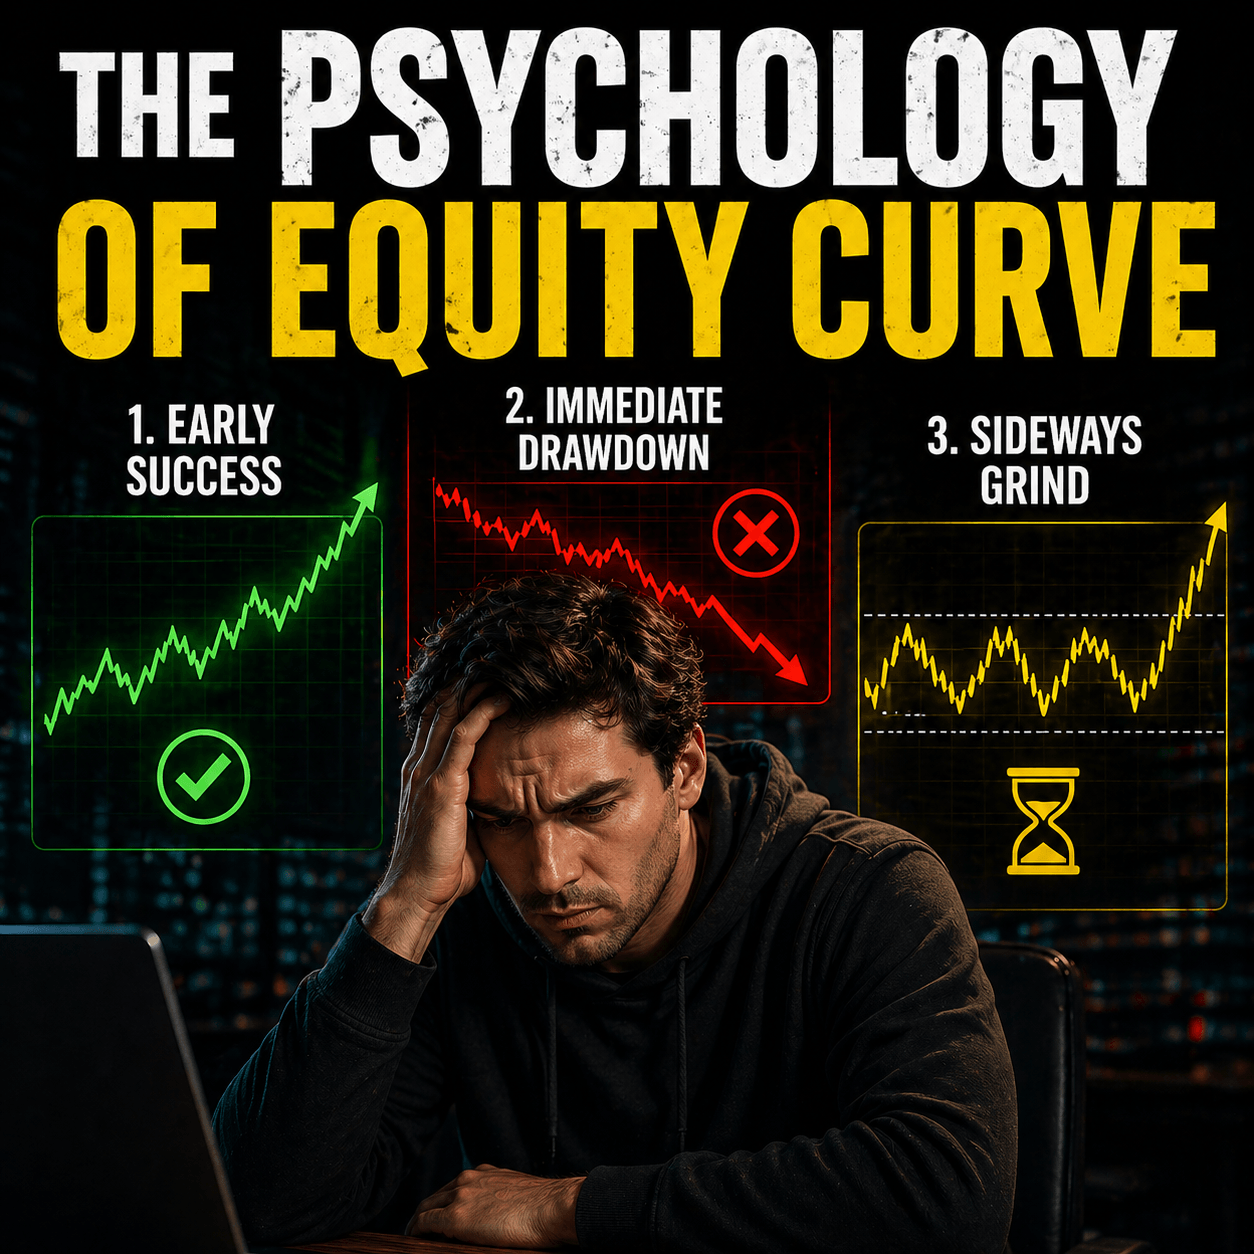
Scenario 1: The Trap of Early Success
In this scenario, you start trading and immediately win. This is actually the most dangerous thing that can happen to a beginner. Why? Because it builds “false confidence.” You start to believe you have “figured out” the market. You think, “If I can make this much risking 1%, imagine how much I’ll make risking 5%!” You increase your risk right before the inevitable losing streak hits. Because your risk is now higher, the losses wipe out all your early gains and more.

Scenario 2: The Immediate Drawdown
You start trading and immediately lose four or five trades in a row. Your brain screams that the strategy is garbage. You feel “uncomfortable” and start “tweaking” the rules. You add a new indicator or change your stop-loss. By doing this, you destroy the very strategy that was designed to work over hundreds of trades. You never give it the chance to reach the winning side of the curve.
Scenario 3: The Sideways Grind
This is perhaps the most frustrating. You don’t lose much, but you don’t win either. For weeks, your account stays at the same level. Most traders get bored. They think the strategy is “outdated” or “too slow.” They quit out of boredom right before the market enters a phase that perfectly suits their original plan.

| Scenario | Emotional Response | Common Mistake | Better Approach |
| Immediate Gains | Overconfidence | Increasing risk/lot size | Stay the course; maintain risk |
| Immediate Loss | Fear/Doubt | Changing the strategy | Trust the backtest; keep trading |
| Sideways Movement | Boredom | Overtrading/Adding indicators | Patience; wait for market shift |
The Math of Success: Knowing Your Backtesting Numbers
To combat the emotional rollercoaster of trading, you must move from “feeling” to “knowing.” This is where backtesting comes in. You cannot manage the psychology of the equity curve if you don’t know what the curve is supposed to look like. You need to look at historical data to find your “boundaries.”
Specifically, you need to find:
Maximum Drawdown: What was the biggest percentage drop the strategy ever took?
Max Losing Streak: How many trades did it lose in a row? (e.g., 8 losses in a row).
Average Recovery Time: How long did it take to reach a new high after a loss?
Once you have these numbers, here is the secret: Assume the future will be 30% worse. If your backtest shows a 10% maximum drawdown, prepare your mind for a 13% drawdown. If your longest losing streak was 7, prepare for 10. By giving yourself this “buffer,” you won’t panic when the “worst-case scenario” happens, because you already expected it.
When you are live trading, your only job is to check if your current results are within these boundaries. If you are in a 5-trade losing streak but your backtest says 10 is normal, then nothing is wrong. You don’t need to fix the strategy; you just need to keep executing. The moment you understand that losses are just a “cost of doing business,” the fear disappears.
The Power of Execution: Changing Your Focus from Profit to Process
Most traders fail because they focus on the one thing they cannot control: the outcome of the trade. You can do everything right and still lose money on a single trade because the market is a game of probabilities. To master the psychology of the equity curve, you must shift your focus entirely to execution.
Execution means taking the trade exactly when your rules say so, without hesitation, and exiting exactly where you planned, without greed or fear. Your job is not to be a “profit maker”; your job is to be a “professional executor.” In our live trading room, we emphasize this daily. We don’t celebrate “big wins” as much as we celebrate “perfect execution.”
Think of it like a professional athlete. A basketball player cannot control if the ball goes through the hoop every time, but they can control their form, their footwork, and their follow-through. If they focus on the process, the points happen naturally. Trading is no different. When you stop obsessing over the dollar amount in your account and start obsessing over whether you followed your plan, the psychology of the equity curve stops being a burden and becomes a roadmap.
The 20-Trade Challenge: Building Your Discipline Muscle

If you want to see if you have what it takes to handle the psychology of the equity curve, I have a challenge for you. Take the next 20 trades using your strategy and follow the rules perfectly.
During these 20 trades:
Try not to change your risk per trade.
Try not to skip a valid signal because you “feel” it might lose.
Do not exit early because you are “scared” to lose a small profit.
Do not “tweak” your indicators.
At the end of the 20 trades, do not look at how much money you made. Instead, grade yourself on a scale of 1 to 20. How many times did you follow your plan perfectly? If you followed it 20 out of 20 times, you have won, even if the account is down. Why? Because you have proven you can execute. Once you can execute, the math of a good strategy will eventually take care of the rest.
Most traders cannot even make it to 5 trades without interfering. By completing this challenge, you are training your brain to ignore the short-term noise and focus on the long-term signal. This is how you move from a struggling trader to someone who understands the psychology of the equity curve.
Conclusion: Stop Fighting the Curve
The secret to trading isn’t finding a strategy that never loses; it’s finding the discipline to stay through the losses. The psychology of the equity curve teaches us that the path to success is rarely a straight line. It is a series of peaks and valleys. Your only goal is to stay disciplined enough to be there when the next peak arrives.
Stop trying to predict what the market will do next and start focusing on what you will do next. If you follow your plan, know your numbers, and focus on execution, you are already ahead of 90% of the people in the market.
Frequently Asked Questions (FAQ)
1. How do I know if my strategy is actually broken or just in a drawdown?
Check your backtesting boundaries. If your current losing streak or percentage loss is significantly worse than anything seen in years of historical data (and you haven’t changed your risk), the strategy might need adjusting. If it’s within the limits, it’s just the psychology of the equity curve at work.
2. Should I stop trading during a bad period?
If you are following your plan and the losses are within your expected “max drawdown,” you should keep trading. If you stop, you will likely miss the “win streak” that naturally follows a losing period, which is how the strategy recovers.
3. Is 20 trades enough to judge a strategy?
No, 20 trades is a test of your discipline, not the strategy’s profitability. To judge a strategy, you usually need a sample size of 100 or more trades. The 20-trade challenge is strictly to see if you can handle the psychology of the equity curve without interfering.
Ready to master your execution?
If you’re tired of doing this alone and want to see how professional execution looks in real-time, join us in our live trading room. We help traders get funded by focusing on what matters: discipline and process.
[Click here to join our Live Trading Room and take your discipline to the next level.]