

Hello guys,
in today’s day trading analysis I would like to look into the AUD/CAD.
There was a nice downtrend formed recently. In this downtrend, there were two heavy volume zones formed. They are best seen if you use my Flexible Volume Profile indicator.
As the sellers were pushing the price into the downtrend, they were adding to their short positions. They did so mostly in those two heavy volume areas.
Usually, when the price makes a pullback into such areas at some point in the future, those areas work as strong Supports/Resistances.
You can actually see that in the first heavy volume area (around 0.9380), which already got tested and the price reacted nicely to it.
AUD/CAD, 30 Minute chart with Flexible Volume Profile:

Strong volume-based resistance at 0.9417
The second heavy volume area, has not been tested yet. This means that it is still a strong resistance.
The heaviest volume peak in this area (= the Point Of Control) was at 0.9417. This is where most of the volumes were traded. Because of this, it is the most important place the sellers will want to defend. That’s why I think it will work as a strong resistance.
Weekly POC
There is one more nice confluence to this 0.9417 resistance. It is the Weekly POC.
If you look at the Weekly Volume Profile (shows how volumes were distributed in this whole week), you can clearly see that the heaviest volumes were traded at 0.9417 – that’s our level!
Weekly POC is a strong level just by itself, but when you combine it with other trading setups then the probability of having a good reaction dramatically rises!
AUD/CAD, 60 Minute chart with Weekly Volume Profile:

Do you want ME to help YOU with your trading?
VWAP confluence
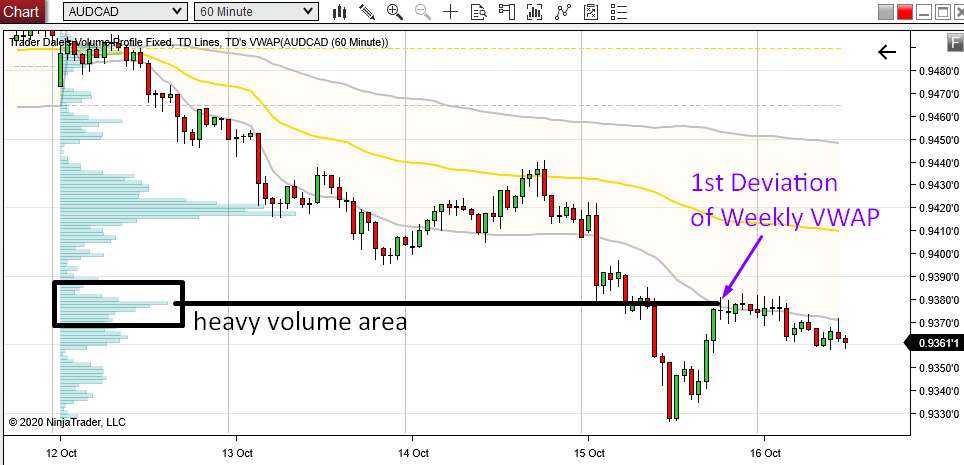
Speaking of confluences, let me talk some more about the first (already tested) resistance which was around 0.9380.
Let’s have a look at it on a 60 Minute chart with Weekly Volume Profile and VWAP.
The Weekly Volume Profile shows nicely the heavy volume area we were able to see earlier when I used the Flexible Volume Profile.
It is always good when you see the same strong levels with the detailed Flexible Profile as well as with the Weekly Profile (which shows the bigger picture).
There was a very nice confluence with the 1st Deviation of VWAP (the grey line) which in this case was supposed to work as a Resistance (based on “VWAP Trend Setup“)
What you see in the picture below is that the heaviest peak of the strong volume zone was EXACTLY at the 1st Deviation when the price hit it.
Support or Resistance level which is both confirmed by Weekly Volume Profile and VWAP 1st Deviation is always really strong one.
This is actually one of my most favorite trading combos I always like to trade.
AUD/CAD, 60 Minute chart with Weekly Volume Profile and VWAP:
I hope you guys liked today’s analysis! Let me know what you think in the comments below.
Have a GREAT weekend and happy trading!
-Dale

I always read your analysis of trades.
Thank you for the explanations.
Thanks for following John!
Why for some cases the resistances/Supports created by these traded volume can be broken (Not even false breakout) ?
Simply because the pressure on the other side is bigger. 🙂
Thank you so much for the good explanation,this is the exact currency i was looking by every news,but i could not find…hear you are given so clearly good to know about this information,once again Thank You very much…keep on be updating like these rare cases…Great job !!
Thank you so much for this kind feedback, I appreciate it!