
Hello guys,
in today’s day trading analysis of CHF/JPY, I would like to show you how to look for trading confluences and how to use them together. such a combination of trading setups helps to find very strong Supports and Resistances.
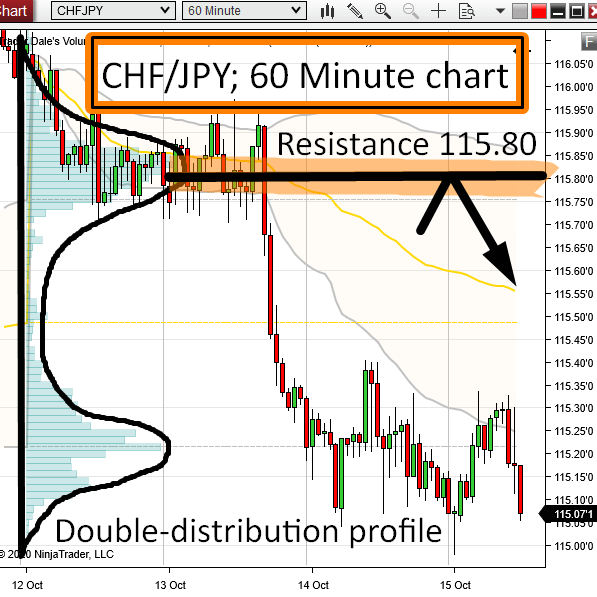
On Tuesday, there was a strong sell-off on CHF/JPY. Before that sell-off, there was a nice rotation that took almost the whole Monday and over half of Tuesday.
Volume Profile analysis
In a rotation like this, heavy volumes are usually accumulated. This was also the case as I discovered when I used my Flexible Volume Profile tool to look into this area.
Because the price went downwards from this rotation zone, I believe that strong institutional sellers were building up their short positions there. When they have accumulated them, they started the strong sell-off with the intention of pushing the price downwards.
When the price makes it back into this area again, I expect that those sellers will want to defend this area and push the price downwards from there again. This is why this level around 115.80 should work as a Resistance.
This setup is called the “Volume Accumulation Setup“.
CHF/JPY, 30 Minute chart:

Double Distribution Volume Profile
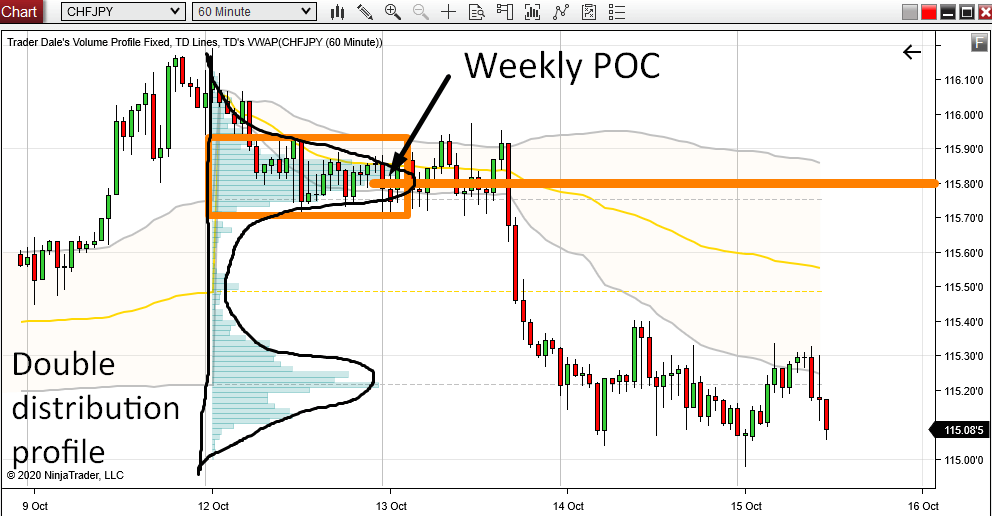
Another thing I wanted to show you is the Weekly Volume Profile (shows how the volumes were distributed throughout the whole week).
This week it formed the “Double Distribution Profile”. This means that there are two heavy volume areas – one at the top of the profile, and the other at the bottom of the profile. I won’t go much into detail on the Double Distribution Profile, but you can read more about it in this article:
How To Trade Double Distribution Profile
In short, the upper volume zone should work as a resistance, and the lower one should work as a support (if there is a pullback from above).
As you can see in the picture below, the upper heavy volume zone nicely aligns with our resistance at 115.80.
As a bonus, there is also the Point Of Control (POC) of the current week – which is also a strong level to trade just by itself!
CHF/JPY, 60 Minute chart with Weekly Volume Profile:
Do you want ME to help YOU with your trading?
Price Action analysis
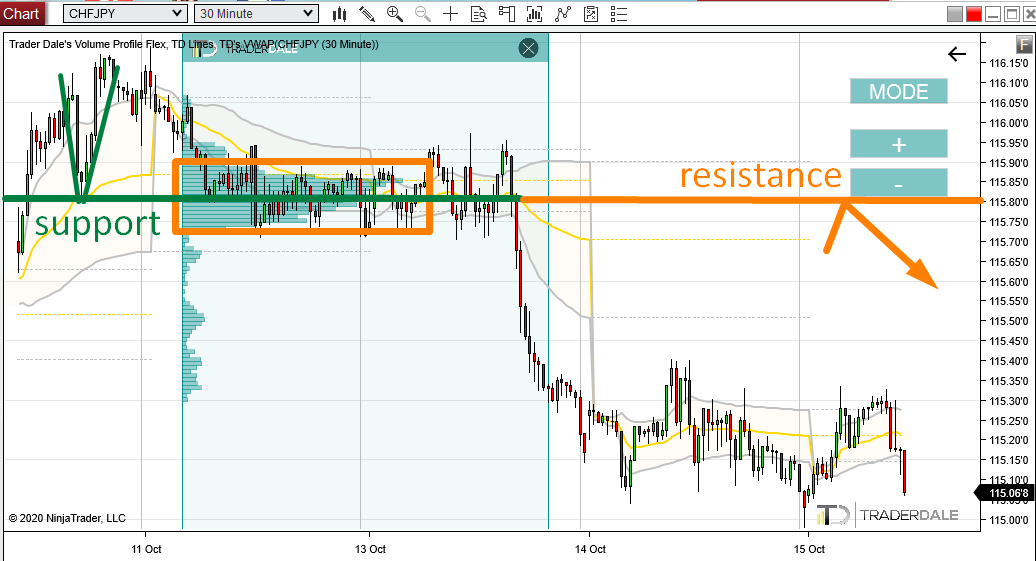
Another thing to notice is how the price reacted to this level in the past. On Friday, there was a nice reaction to this level – a rejection of lower prices. This clearly showed that this level worked as a support.
When the Support got breached, it then became a Resistance. This is a well known, old Price Action setup (old but working:)).
You can read more about this setup here:
Price Action Setup: Support Becoming Resistance
CHF/JPY, 30 Minute chart
VWAP analysis
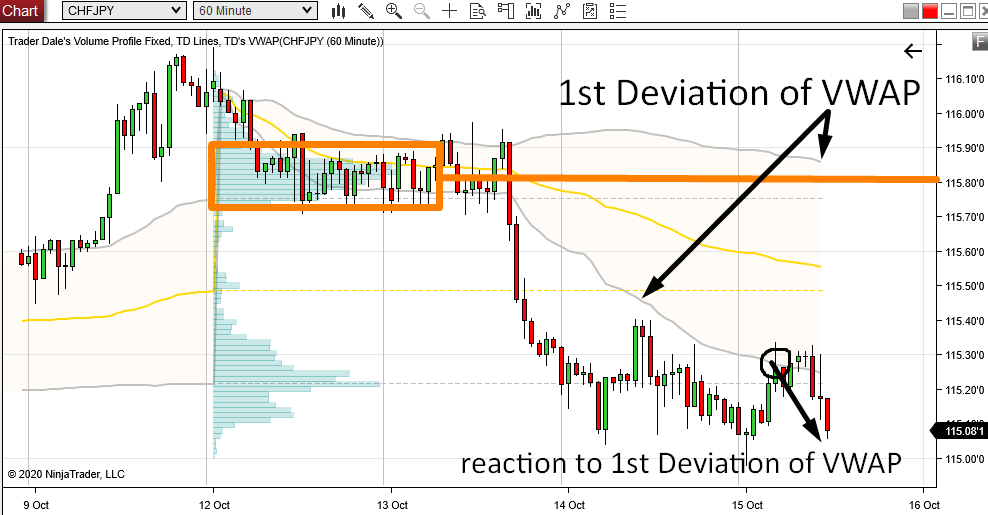
One more thing I always look at is VWAP, and more importantly it’s 1st Deviations (the grey lines).
Those work as strong Supports and Resistances and you can build your trading just around them.
What I personally prefer is to use them in confluence with other trading setups, preferably with Volume Profile setups.
Like in this case – there is our resistance around 115.80 and very close to it is the 1st Deviation of VWAP which should also work as a Resistance! This is the sort of confluence I like to see!
The picture below shows those 1st deviations and you can notice how nicely the price has already reacted to the lower one (this is what I call the VWAP Trend Setup).
Trading is a game of probability
With so many nice confluences this Resistance around 115.80 simply must work, right?
Wrong!
It does not! All those confluences play in our favor and make it more likely that it will work but it can still fail and the price can just shoot past it without any reaction (not too much likely scenario, but it can happen).
Why am I writing this? To tell you that there is nothing 100% certain in trading. It is a game of probability which you can turn into your favor. But even if you had 70% probability of winning, there still is the 30% probability of losing. So keep that in mind and don’t go too crazy with your money management.
I hope you guys liked today’s analysis! Let me know what you think in the comments below.
Happy trading!
-Dale

sir your emails are highly informative and so useful. Thanks for sharing your knowledge
I’m really glad to hear I’m helping you Arun, keep it going! 🙂