

Hello guys,
today’s trade analysis will be on EUR/AUD. It won’t be a standard day trading analysis because I will do it from a higher perspective than from the standard 30 Minute time frame.
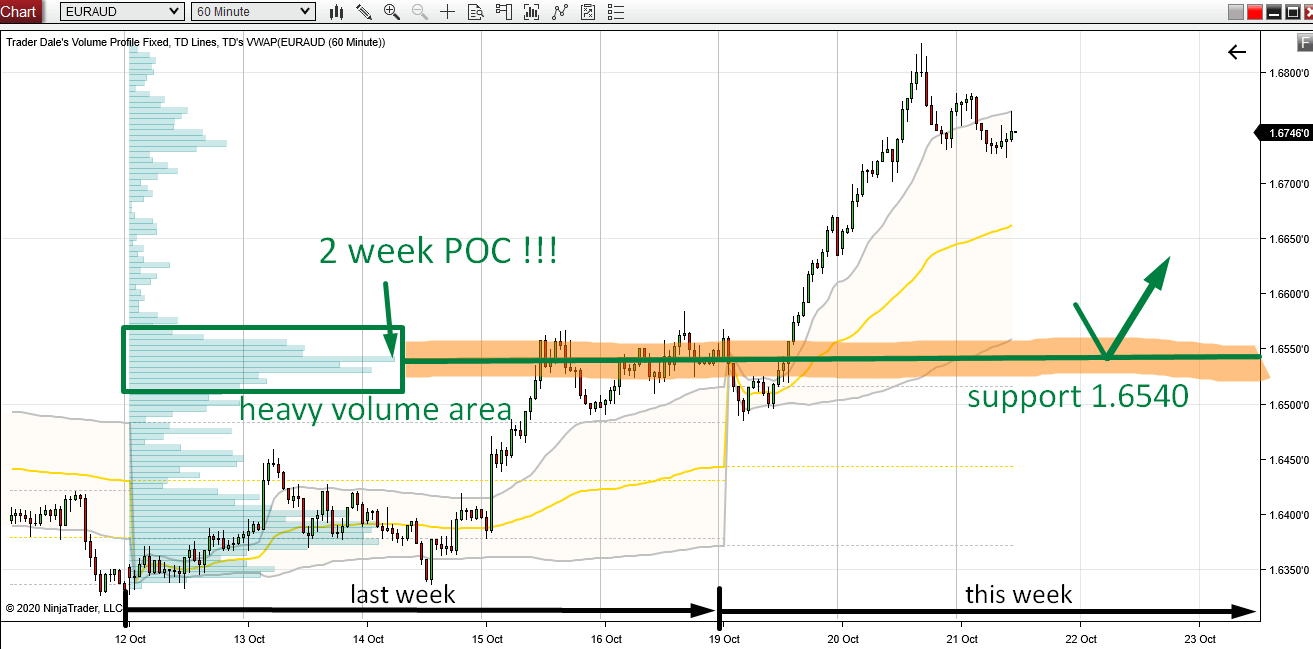
This time, I will use a 60 Minute time frame and Weekly Volume Profile.
What caught my eye here at the first sight was a very strong Point Of Control (POC). This POC was 2 week POC, which means that this was the place where most volumes got traded in the last 2 weeks!
From this place, a strong buying activity started and caused an uptrend.
What does that say? It says that strong buyers were building up their long positions in a rotation. We see their volumes on Volume Profile. Then they pushed the price upwards.
What happens when the price makes it back into this area again? The buyers should start defending their longs.
They placed most of them at 1.6540 (that’s the strong POC). It is this area they will want to defend the most.
This is the reason it should work as a strong support.
EUR/AUD, 60 Minute chart with 2 Weekly Volume Profiles merged together:
Do you want ME to help YOU with your trading?
Resistance turning into a Support
The 1.6540 Support is not only a strong level because of the 2 week POC, but also because it worked as a strong Resistance in the past.
If you look at the chart below, you can see how nicely the price reacted to this Resistance before.
When this Resistance got breached and the price went above it, it then turned into a Support.
You can read more about this Price Action setup here:
Price Action Setup: Support Becoming a Resistance
This support is exactly at our 2 week POC which creates a very nice confluence of two trading signals. Both telling us that the area around 1.6540 should work as a strong support.
EUR/AUD, 60 Minute chart:

Position Management
Because this trade analysis was made from a higher perspective, we also need to adjust our Take Profit and Stop Loss for this.
In this case the ideal SL would be around 55 pips, and the TP at least the same.
If you would like to know why, then I suggest you check my Volume Profile webinar, where I explain (among other things) how to set your SL/TP using Volume Profile. You can watch the recording here:
I hope you guys liked today’s analysis. Let me know what you think in the comments below!
Happy trading!
-Dale

Great article Dale. I always read them.
Thanks John!
You are amazing, tks Dale !
Thank you very much. 🙂