
Hello guys,
today I am going to do an intraday analysis of EUR/GBP.
The EUR is now gaining all across the place and EUR-related currency pairs are trending.
This also goes for the EUR/GBP.
Volume Profile analysis
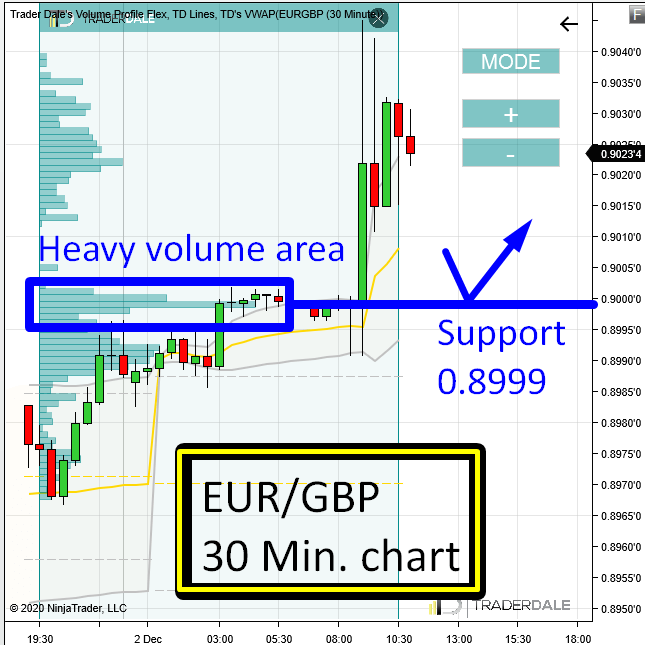
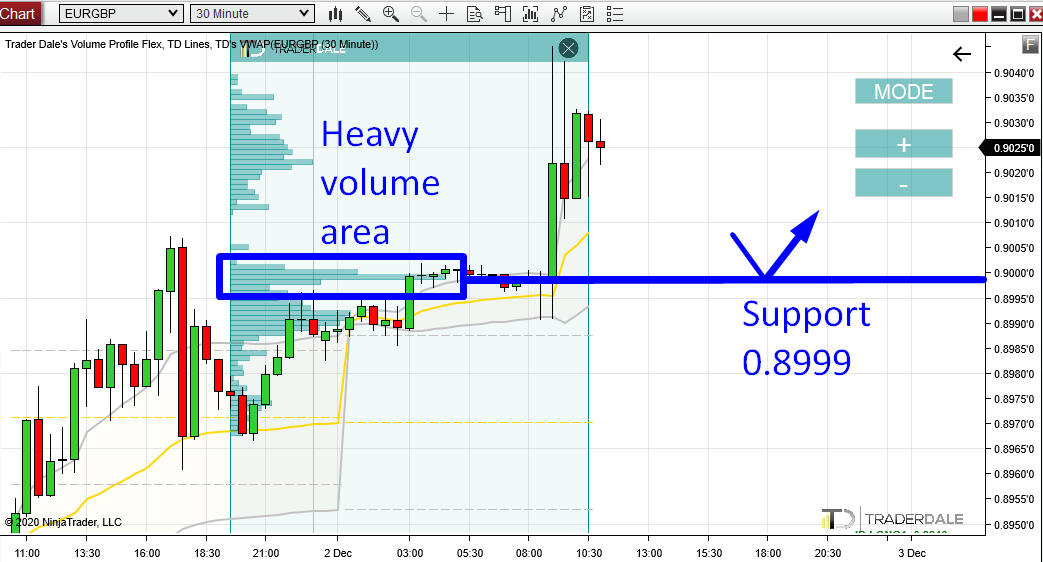
When there is a trend I look for significant Volume Clusters which I use as Supports and Resistances.
The closest Volume Cluster is currently around 0.8999. Massive volumes were placed in the market there and then there was a strong buying activity after.
This indicates that Buyers were building up their Long positions in that Volume Cluster around 0.8999 and then they pushed the price upwards.
When there is a pullback to this area in some point in the future, then I think that those Buyers will want to defend this area and that they will push the price upwards from there again.
That’s why I think this zone should work as a Support.
This setup which I used is one of my favorite volume-based setups and it is called the “Trend Setup“.
EUR/GBP, 30 Minute chart:
Price Action analysis
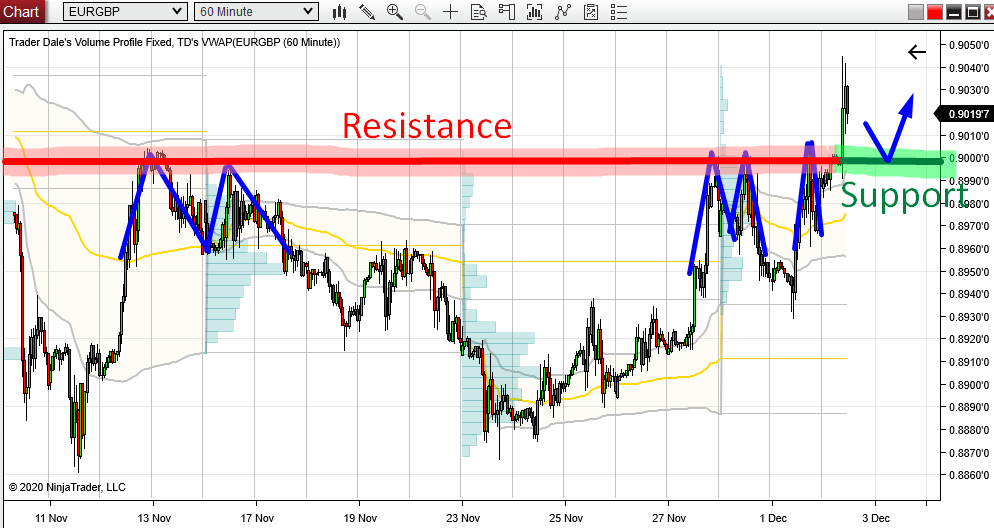
What I really like about this 0.8999 Support is the confluence of Volume Profile setup and Price Action setup.
This Price Action setup says that a breached Resistance becomes a Support.
Below is a 60 Minute chart, where you can nicely see how many times the price reacted to the zone around 0.8999 in the past.
There were so many reactions! This level worked as a strong Resistance. However, today the Resistance got finally breached and it turned into a Support.
What is so strong about this is that the Price Action setup and the Volume Profile setup nicely align and support each other. They point to the same place of the chart!
This adds to the strength of the Support!
EUR/GBP, 60 Minute chart:
Do you want ME to help YOU with your trading?
VWAP analysis
Another nice confluence to this Support is the Weekly VWAP. More precisely it’s 1st Deviation (that’s the grey line).
As you can see in the picture below, this line is very close to out 0.8999 Support.
If the price hits this Support and the 1st Deviation is somewhere around (like now), then it will be another nice confluence to add to the strength of the level!
Why? Because when the market starts to trend, then it usually bounces of the 1st Deviations. So right now, if the price made a pullback downwards, then it should bounce off from the 1st Deviation.

Setup Summary
To sum this up – in today’s analysis I used three trading setups to identify a strong day trading Support on EUR/GBP. All those setups point to the same place in the chart (0,8999), telling me that it should work as a strong Support.
Here are the setups with links to articles, where you can learn more about them:
I hope you guys liked today’s analysis! Let me know what you think in the comments below!
Happy trading!
-Dale

Thank you, Dale, for this analysis it’s really helped with a more in-depth view.
Keep up the great work much appreciated Karl
My pleasure Karl, thank you for your kind feedback!
Good analysis, and thank you!
You’re welcome as always. 🙂
you are the best Dale !
Thank you Ahmed! 😀
Price traveled from 0.8999 to 0.9084, thanks for 80 pips
It helped me alot… Thanks for good analysis… You’re the best.
great analyses bro thank you….sooo much
So I don’t answer each of you separately, it’s my pleasure guys, you deserve it.
Hi Dale… can you please so a video explaining the how the deviations works and how to plot them on charts. Thanks in advance
Of course Tony, I already covered that: https://www.trader-dale.com/vwap-trading-strategies-webinar/ 🙂