Introduction: My 16-Year Journey to the Best Volume Setup
If you’ve been searching for a reliable way to read the markets, you’ve come to the right place. My name is Dale, and I’ve been trading the financial markets for 16 years. My primary tool, for most of that time, has been the Volume Profile.
Over those 16 years, I’ve tested dozens of setups. Some worked for a while, some didn’t. But one specific piece of logic has survived every market condition I’ve thrown at it — and that’s what this article is about. Today I’m going to walk you through my absolute favourite strategy: trading pullbacks using a Volume Cluster as the entry zone, confirmed by historical price reaction.
This is the same approach I cover in the video above. If you prefer reading, keep scrolling.
Table of Contents
Summary of the Article in 5 Points
Short on time? Here’s the quick version of my #1 strategy:
- Identify the trend — you need a clear, strong move up or down, not sideways chop.
- Draw your Flexible Profile — drag it over the trending move, not the whole day.
- Find the Volume Cluster — the big “belly” of the profile is where institutions loaded their positions.
- Check for historical reaction — has price stalled, reversed, or reacted at this level before? That confirms it.
- Wait for the pullback entry — place your limit order at the cluster and let price come to you.
That’s it. The details below explain exactly how to execute each step.
The Core Strategy: How to Trade Using Volume Profile and POC
Most retail traders look at where price is right now. I look at where the volume was. That’s the fundamental shift that changed everything for me.
Tools like RSI and moving averages are based on price history alone — they tell you what happened, but not why. The Volume Profile is different. It tells you exactly where the most intense buying and selling occurred. And because large institutions — the ones actually moving markets — have to execute their orders at specific levels, those levels leave a visible footprint in the volume data.
When I see a significant volume cluster during a trending move, I’m not just looking at a number. I’m looking at where JP Morgan, Goldman Sachs, or a large hedge fund was building their position. And they will defend that level if price returns to it.
What is a Volume Cluster?
A volume cluster is a price area where a large amount of trading activity took place. On your Volume Profile chart, it shows up as a wide horizontal bar — the wider the bar, the more volume traded at that level.
Think of it as a battlefield. During a strong trend, these clusters mark where big players were aggressively entering the market. Because institutions trade in such large sizes, they can’t get filled all at once — they need multiple candles, sometimes multiple sessions, to build their full position. That process leaves behind a distinct cluster in the Volume Profile.
When price later pulls back to that cluster, those same players will often defend their position. That’s the trade — you’re not guessing support and resistance, you’re reading the actual evidence of where large money entered.
The Logic of Price Memory
Markets have memory. A level that was hard to break through in the past — a resistance ceiling — often becomes a support floor once price finally pushes through it with conviction.
This is the classic support-resistance flip, but Volume Profile makes it precise. Instead of drawing an arbitrary horizontal line, you’re pinpointing the exact price range where the volume-backed transition happened. You’re not estimating — you’re reading the data.
The combination of high volume at a level and historical price reaction at that same level is what makes the trade high probability. One without the other is okay. Both together? That’s when I get excited.
This is the core of what I also cover in my Volume Profile trading course — reading levels that have both volume evidence and price memory behind them.
The Bullish Blueprint: Turning Resistance into Support
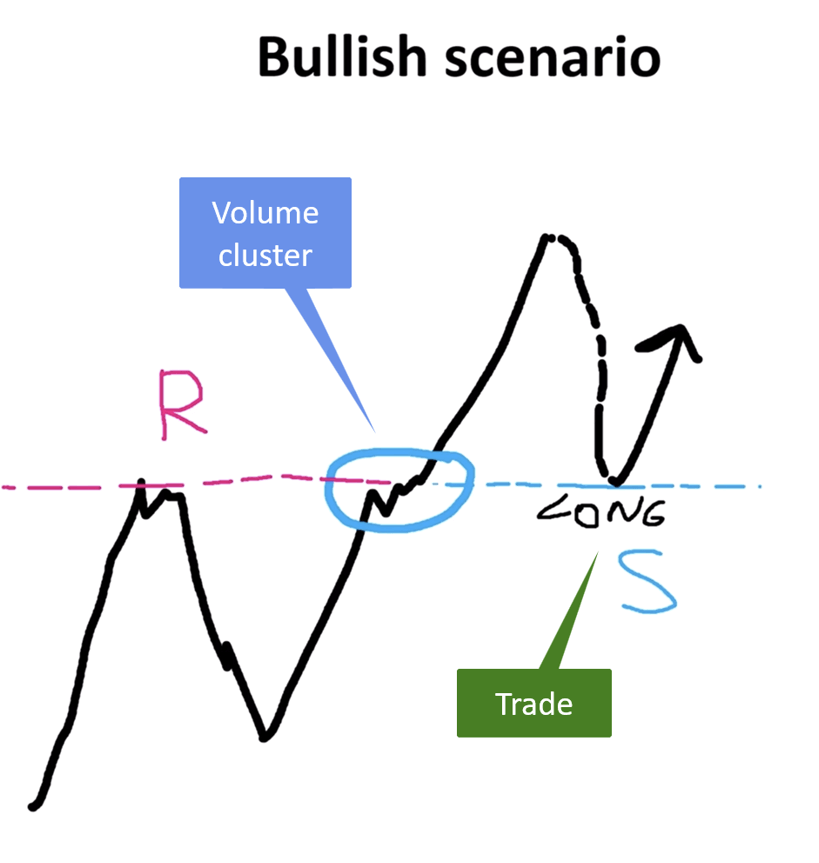
In a bullish setup, I need to see buyers clearly in control. Here’s the exact sequence I look for:
- A strong upward move — not just a small bounce, but a real momentum leg where price moves aggressively higher.
- A significant volume cluster within that move — I drag my Flexible Profile over the trending leg and look for the widest bar. That’s where institutions were building long positions.
- Historical price reaction at the same level — I scroll left and check whether price struggled at this level before. A previous resistance that price had difficulty breaking is ideal. Even a small stall or pause counts.
- Wait for the pullback — once I’ve identified the level, I place a limit buy order there and let price come to me. No chasing, no guessing.
The stop-loss goes below the cluster. The target is the high of the trending move, or the next significant resistance level above. I always check the VWAP levels nearby as well — when a volume cluster and a VWAP level coincide, the confluence makes the setup even stronger.
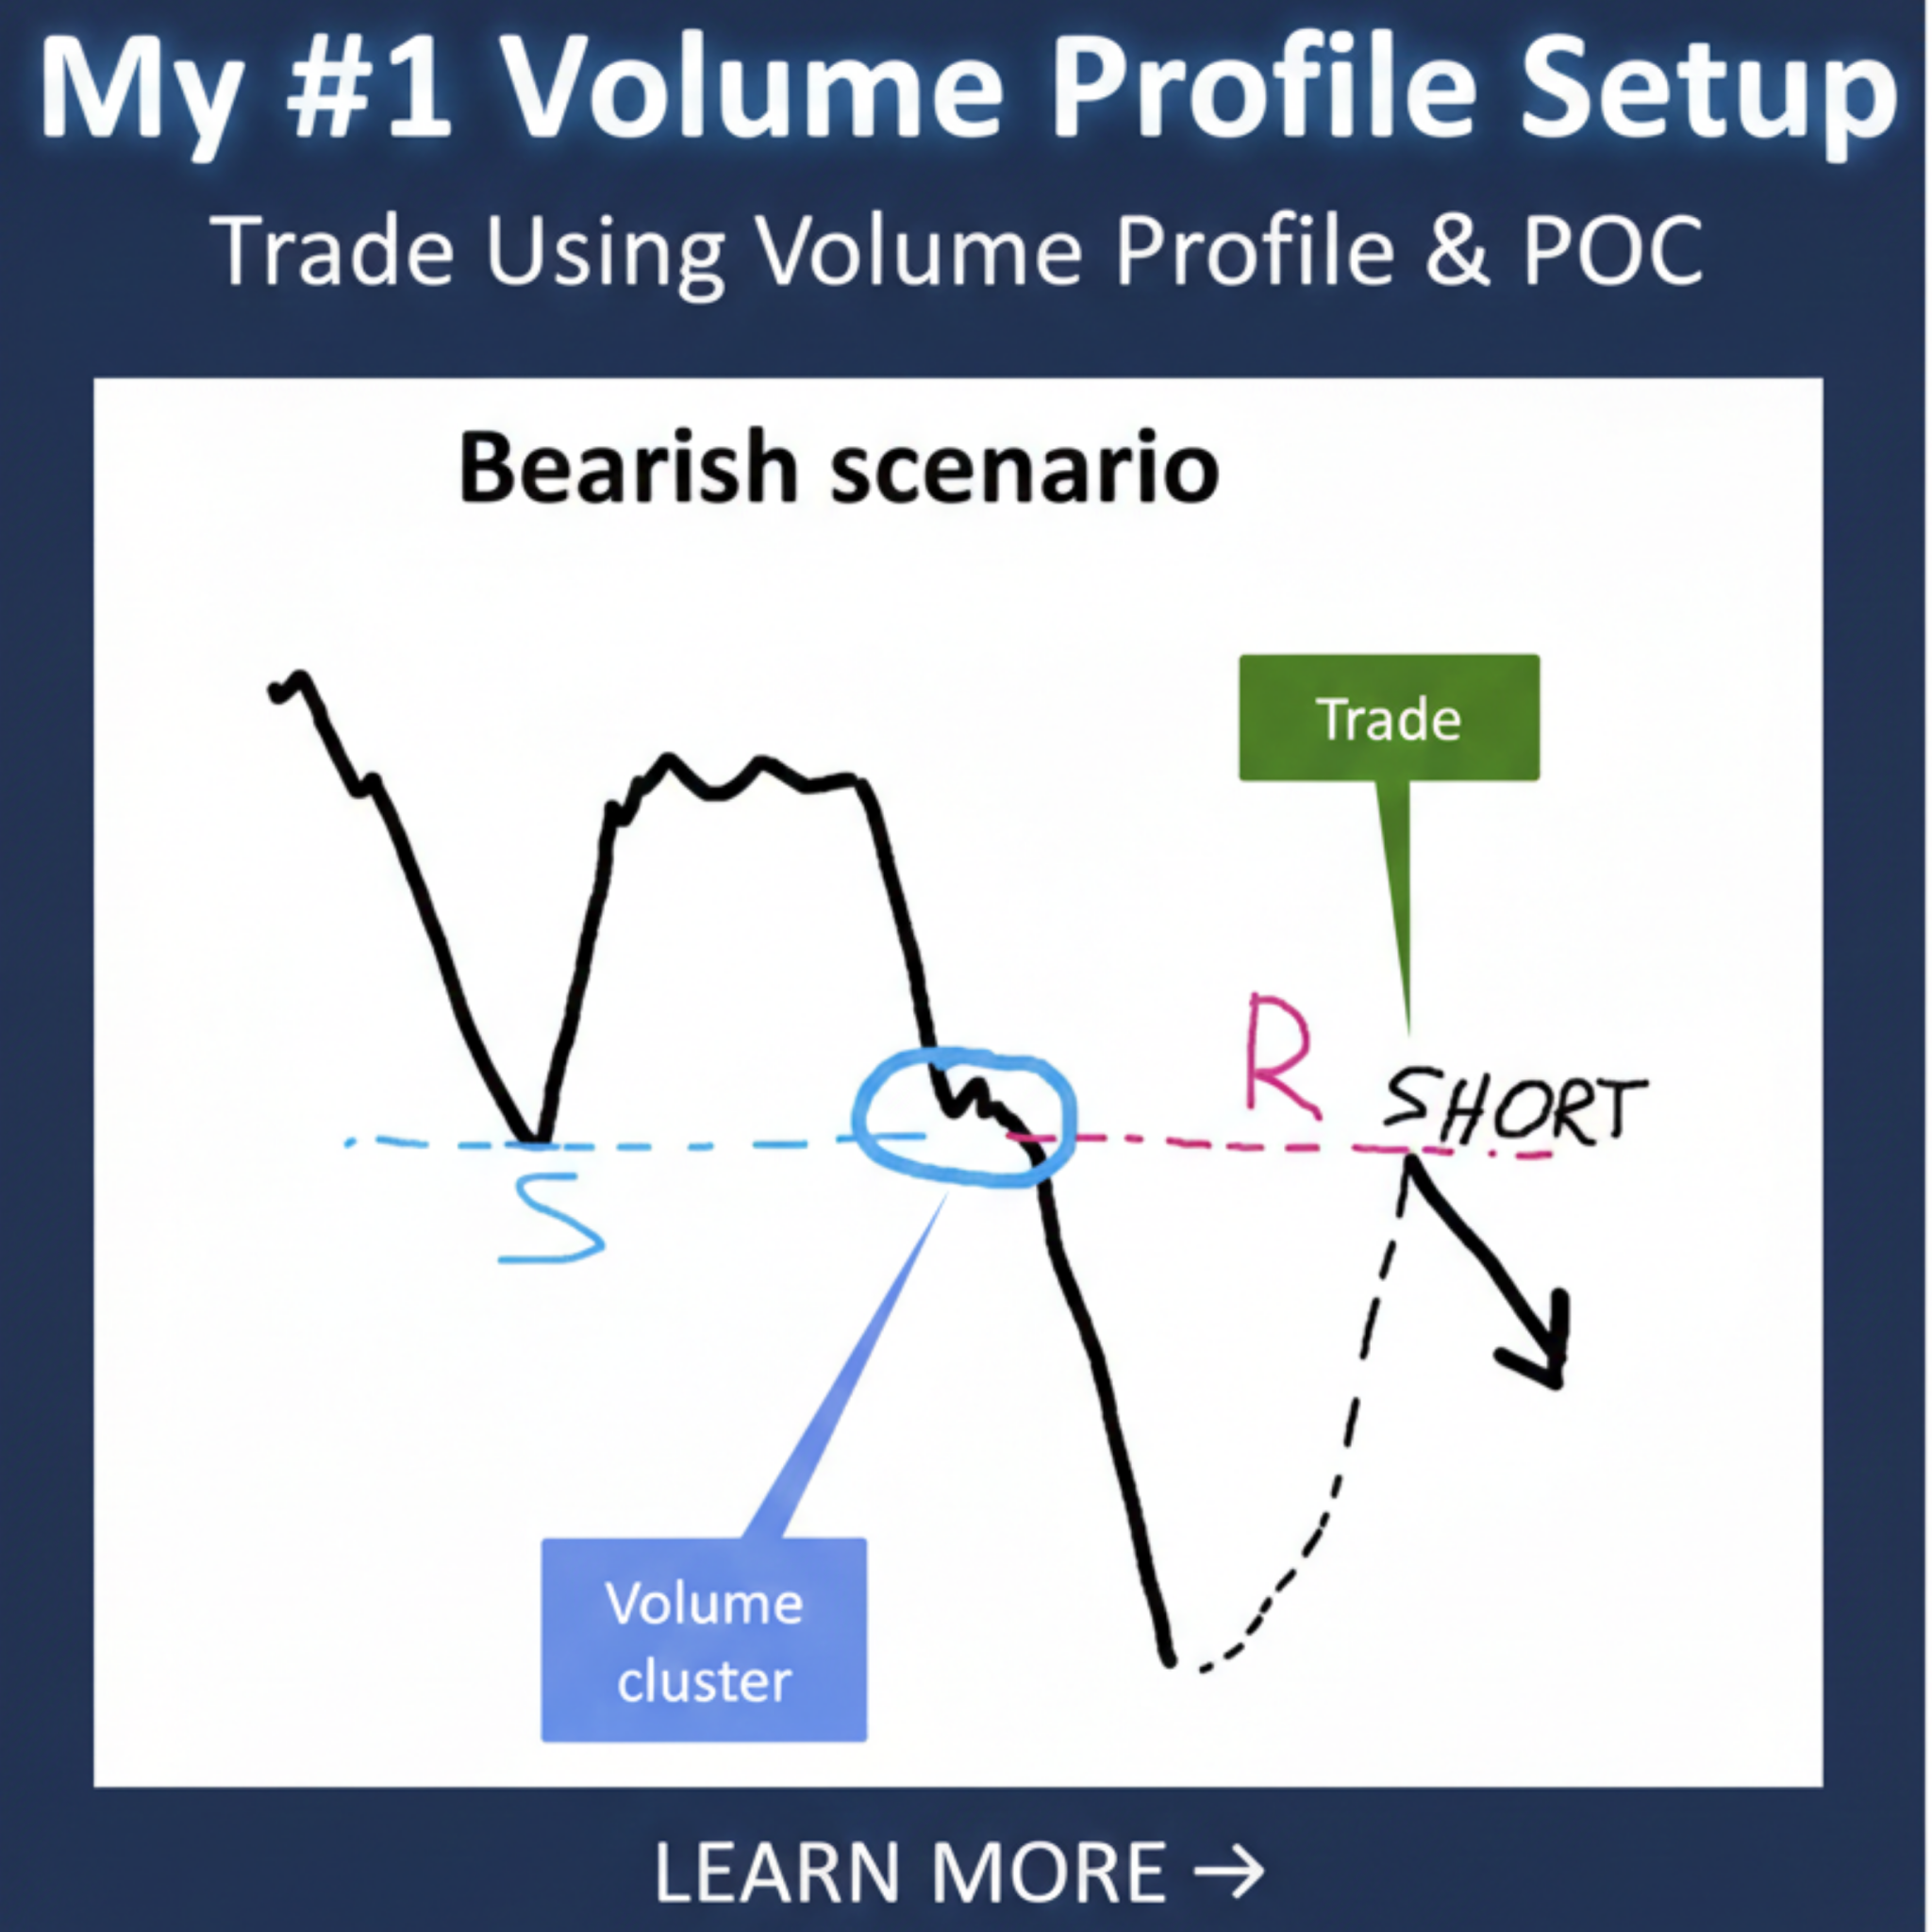
The Bearish Blueprint: Trading the Downtrend

The bearish version is the exact same logic, just flipped. When the sellers are in control, I’m looking for where they loaded up — and where they’ll defend their position if price retraces.
- A strong downward move — lower highs, lower lows, clear seller momentum.
- A volume cluster within the down move — the big bar on the Flexible Profile shows where institutions were building short positions.
- Historical support at the same level — I look left to find if price bounced or hesitated at this level before. A former support that gets broken and retested as resistance is the classic scenario.
- Wait for the retracement entry — I place a limit sell order at the cluster level and wait. The stop goes above the cluster, the target is the low of the trending leg.
One thing I want to be clear about: this isn’t a mechanical system where you just slap in an order and walk away. You still need to read the context — is the overall market in a downtrend? Is there a major news event coming? But the Volume Cluster gives you a precise, data-backed entry level rather than a guess.
Why the "Flexible" Profile is Your Secret Weapon
Not all Volume Profiles are the same, and the tool you use matters.
Most traders start with a Fixed Range or Daily Volume Profile. These are fine for getting an overview, but they include data from sideways ranges, choppy sessions, and irrelevant price action. When you’re trying to find where institutions entered during a specific trend, all that noise makes it harder to identify the meaningful cluster.
What I use — and what I teach — is the Flexible Volume Profile. Instead of showing the whole session or a fixed range, you manually drag it over just the trending move you care about. The result is a clean, precise profile that shows you exactly where the volume concentrated during that specific move.
The difference between Fixed and Flexible comes down to this: Fixed shows you everything; Flexible shows you what matters. Yes, it requires a manual drag each time — but that extra step is what gives you the precision edge that most retail traders simply don’t have.
To keep it simple: a Fixed Profile covers the whole session or a fixed date range, which means it picks up a lot of sideways noise. A Flexible Profile is manually drawn over just the trending leg, giving you a clean read of where institutions were active during that specific move. The Flexible Profile requires a bit more work — you have to select the range yourself — but that’s exactly why it’s more powerful. You get precision rather than average.
Real Chart Examples and Case Studies
Theory is one thing — let’s look at what this actually looks like on a chart. These examples are the same two setups I walk through in the video above.
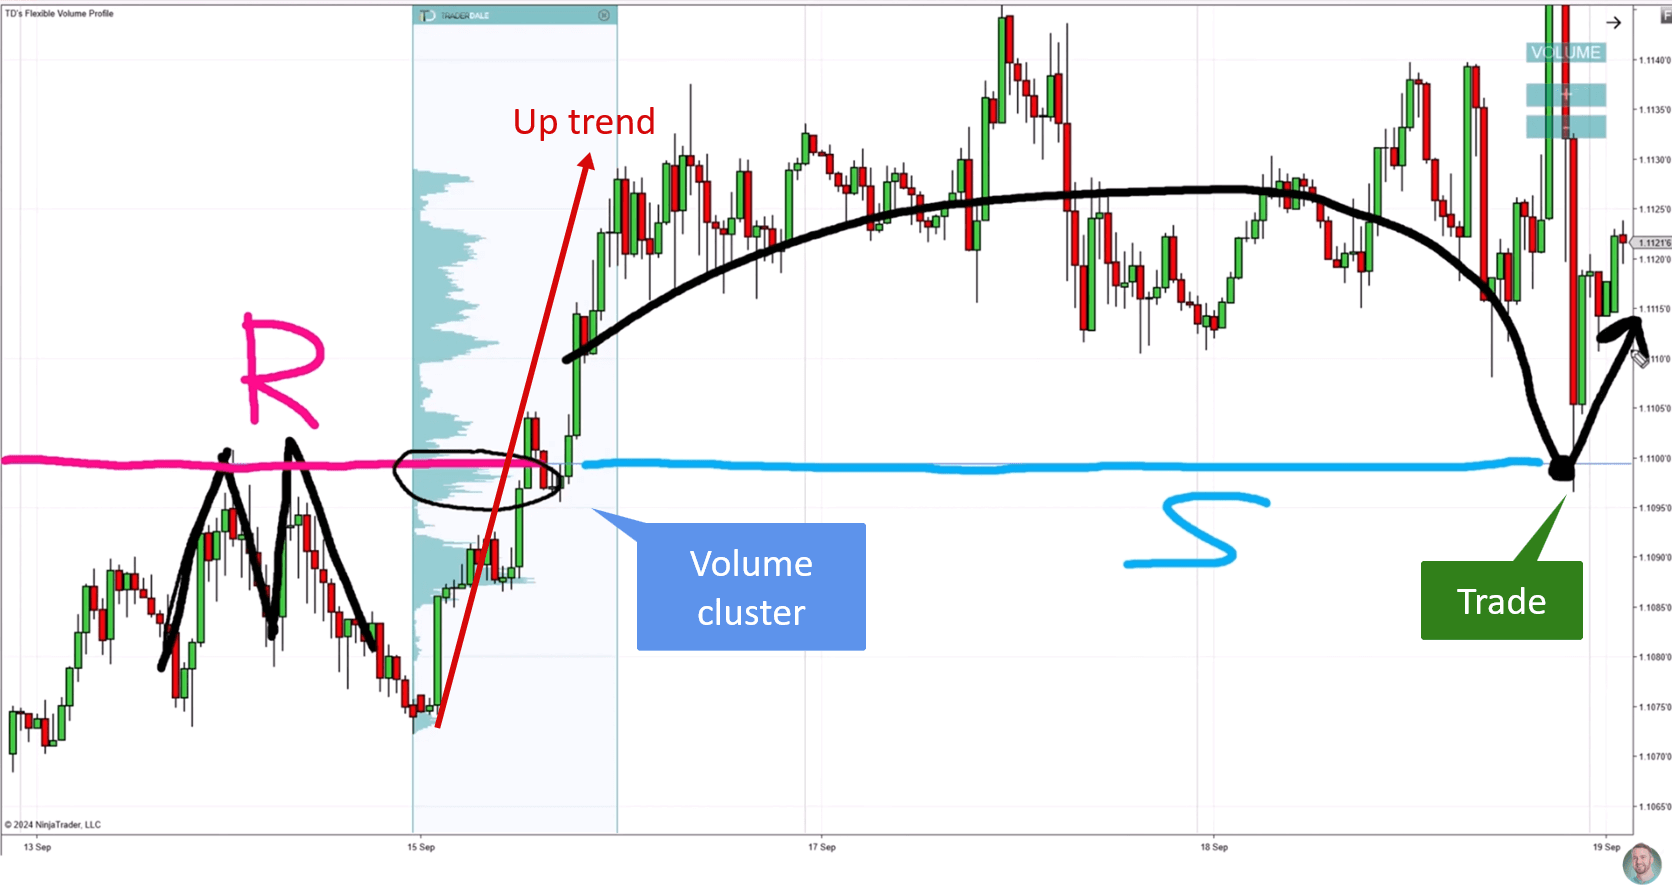
Example 1: The "Perfect" Bullish Pullback
Take a EUR/USD chart. Price shoots up 50 pips in a clean bullish leg. I drag my Flexible Profile over that move and immediately see a big cluster at 1.0850 — that’s where the bulk of the volume traded during the rise.
Then I scroll left. Price had been struggling to break above 1.0850 the previous session — it was acting as resistance. That’s my confirmation. I set a limit buy at 1.0850, stop below the cluster, and wait for price to pull back.
When it does pull back and touches that level, it bounces. Clean entry, clean trade. This is the “perfect” bullish setup — strong trend, big cluster, and clear historical resistance now acting as support. Not every trade is this textbook, but when all three align, I’m confident placing the order.
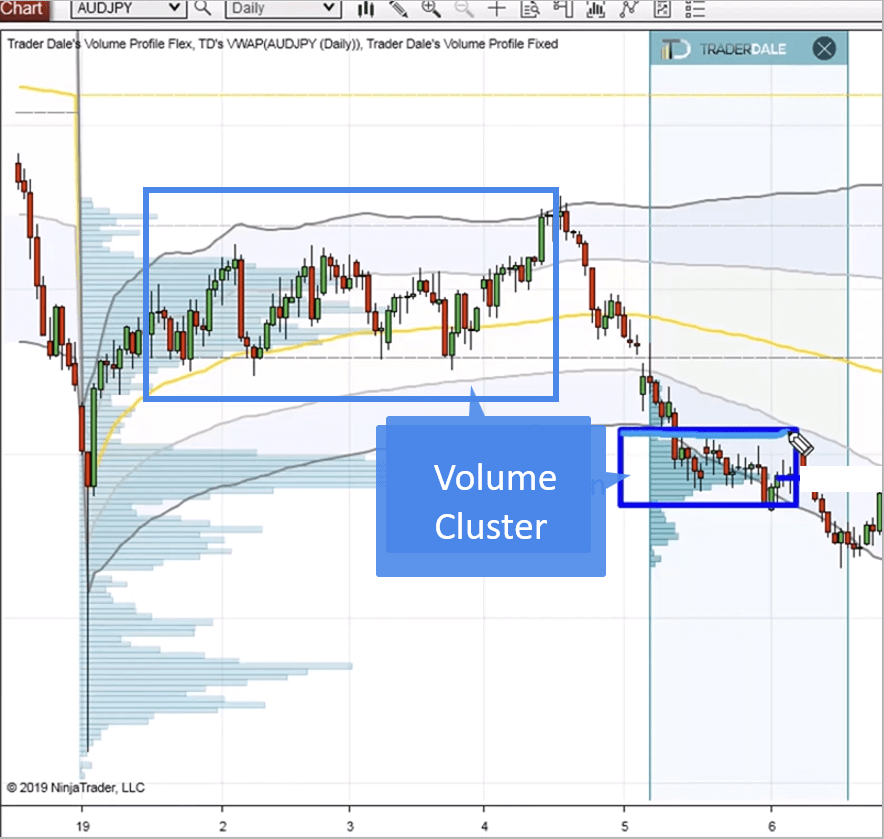
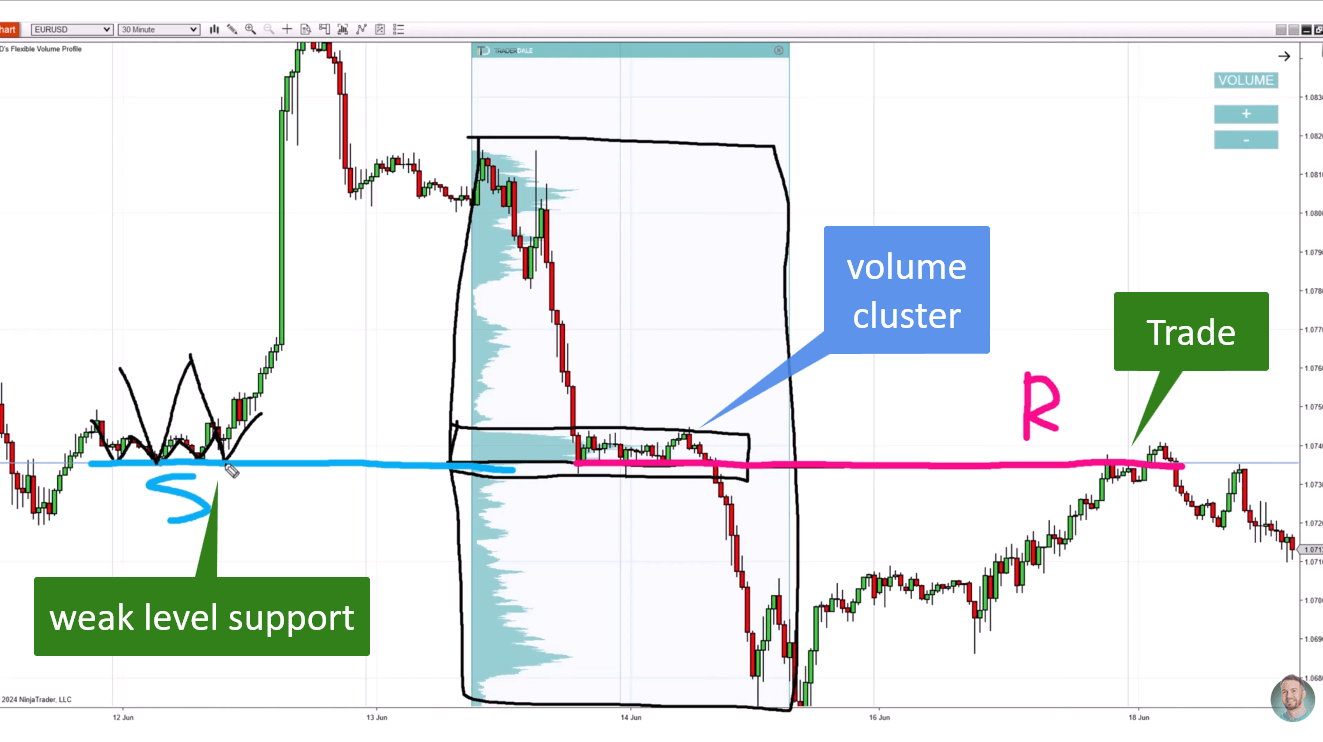
Example 2: When Support is "Weak"
The second example is a short setup, and it illustrates something important: the historical reaction doesn’t have to be dramatic to be valid.
In a downtrend, I find a large volume cluster within a bearish leg. When I scroll left to check history, there’s no massive reversal at that level — just a small stall, a brief pause where price slowed down before continuing. Some traders would dismiss this as “weak” support.
I still take the trade. Here’s why: the volume cluster is the primary signal. If a massive amount of trading happened at that level during the bearish leg, institutions were building short positions there. A small historical reaction is enough to confirm the level has market memory. I place my limit sell, stop above the cluster, and wait for the retracement.
The trade works. This is a good reminder that “weak” historical reaction combined with a strong volume cluster can still produce a high-probability entry — the volume evidence outweighs the lack of a dramatic price reaction.
Conclusion & FAQ
After 16 years of trading, this Volume Cluster + historical reaction setup is still my go-to. It’s not a shortcut or a magic indicator — it’s a logical, evidence-based approach to finding high-probability entries.
The two things that make it work: first, the volume cluster tells you where institutions actually traded, not where an algorithm thinks they might trade. Second, the historical price reaction confirms the level has significance in the market’s memory. When both are present, you’re not guessing — you’re reading real data.
If you want to go deeper into this, I cover the full methodology — including how to trail your stop-loss using Volume Profile once you’re in a trade — in my detailed guides. And if you want to learn how order flow complements this strategy by showing real-time institutional activity, that’s a natural next step from here.
For traders looking to take this seriously — whether prop firm trading or live accounts — check out what I cover in the Funded Trader Academy.
Here are the questions I get asked most often about this strategy:
A volume cluster is a price area where a significant amount of trading activity took place, visible as a wide horizontal bar on the Volume Profile. It matters because it shows where large institutions — banks, hedge funds, major players — were actively buying or selling. When price returns to that area, those same institutions often defend their position, which creates a high-probability entry zone. You’re not guessing the level; you’re reading direct evidence of where large money traded.
No level holds 100% of the time, but you can significantly improve your odds by requiring two things: first, a large volume cluster at the level (the wider the profile bar, the more institutions were involved); and second, a historical price reaction at or near that same level — a previous reversal, a stall, or a change of behaviour. When both are present, the level has both volume evidence and market memory behind it, which is the core of why this strategy works.
For pullback entries, I typically place my limit order at the top edge of the cluster (for longs) or bottom edge (for shorts) — the area where price first touches the zone on its return. The Point of Control (POC) is the highest-volume node within the cluster and is often used as a target or stop reference. If you’re more conservative, waiting for the POC to be tested gives you more confirmation, but you may miss faster moves that reverse at the edge of the cluster.
This does happen, and it’s important to accept it as part of trading. If price breaks through your cluster with conviction — not just a brief spike but a real close beyond it — that’s a signal the level has failed. In that case, your stop-loss should have already taken you out of the trade. A failed volume level isn’t wasted information though; a cluster that gets broken often flips from support to resistance (or vice versa), which can create a new trade setup in the opposite direction.
There’s no single number because it’s relative — the cluster needs to be noticeably wider than the bars around it. What you’re looking for is a clear visual ‘belly’ in the profile, not just a slightly thicker bar. In practical terms, I want the volume node to represent at least 15-20% of the total volume in the profile range — though I judge this by eye rather than by calculation. If the profile looks roughly even across all levels, there’s no dominant cluster to trade. Wait for a session where one area clearly attracted significantly more volume than the rest.
My primary take-profit is the opposite end of the volume cluster I entered from — if I entered at the bottom edge of a cluster going long, my target is the high of the trending leg that created the cluster. A secondary method is using the next significant volume node above (for longs) as the target, since price often pauses or reverses at the next high-volume area. I avoid arbitrary fixed targets like ’20 pips’ or ‘1R’ because they don’t respect the actual market structure. Let the Volume Profile tell you where to take profit — it’s already showing you where institutions are likely to act.