Have you ever entered a trade at a perfect support level, only to watch price rip straight through it? I’ve been there. For years I traded price alone — and I kept getting caught out by moves that looked impossible on the candle chart but made complete sense once I understood order flow.
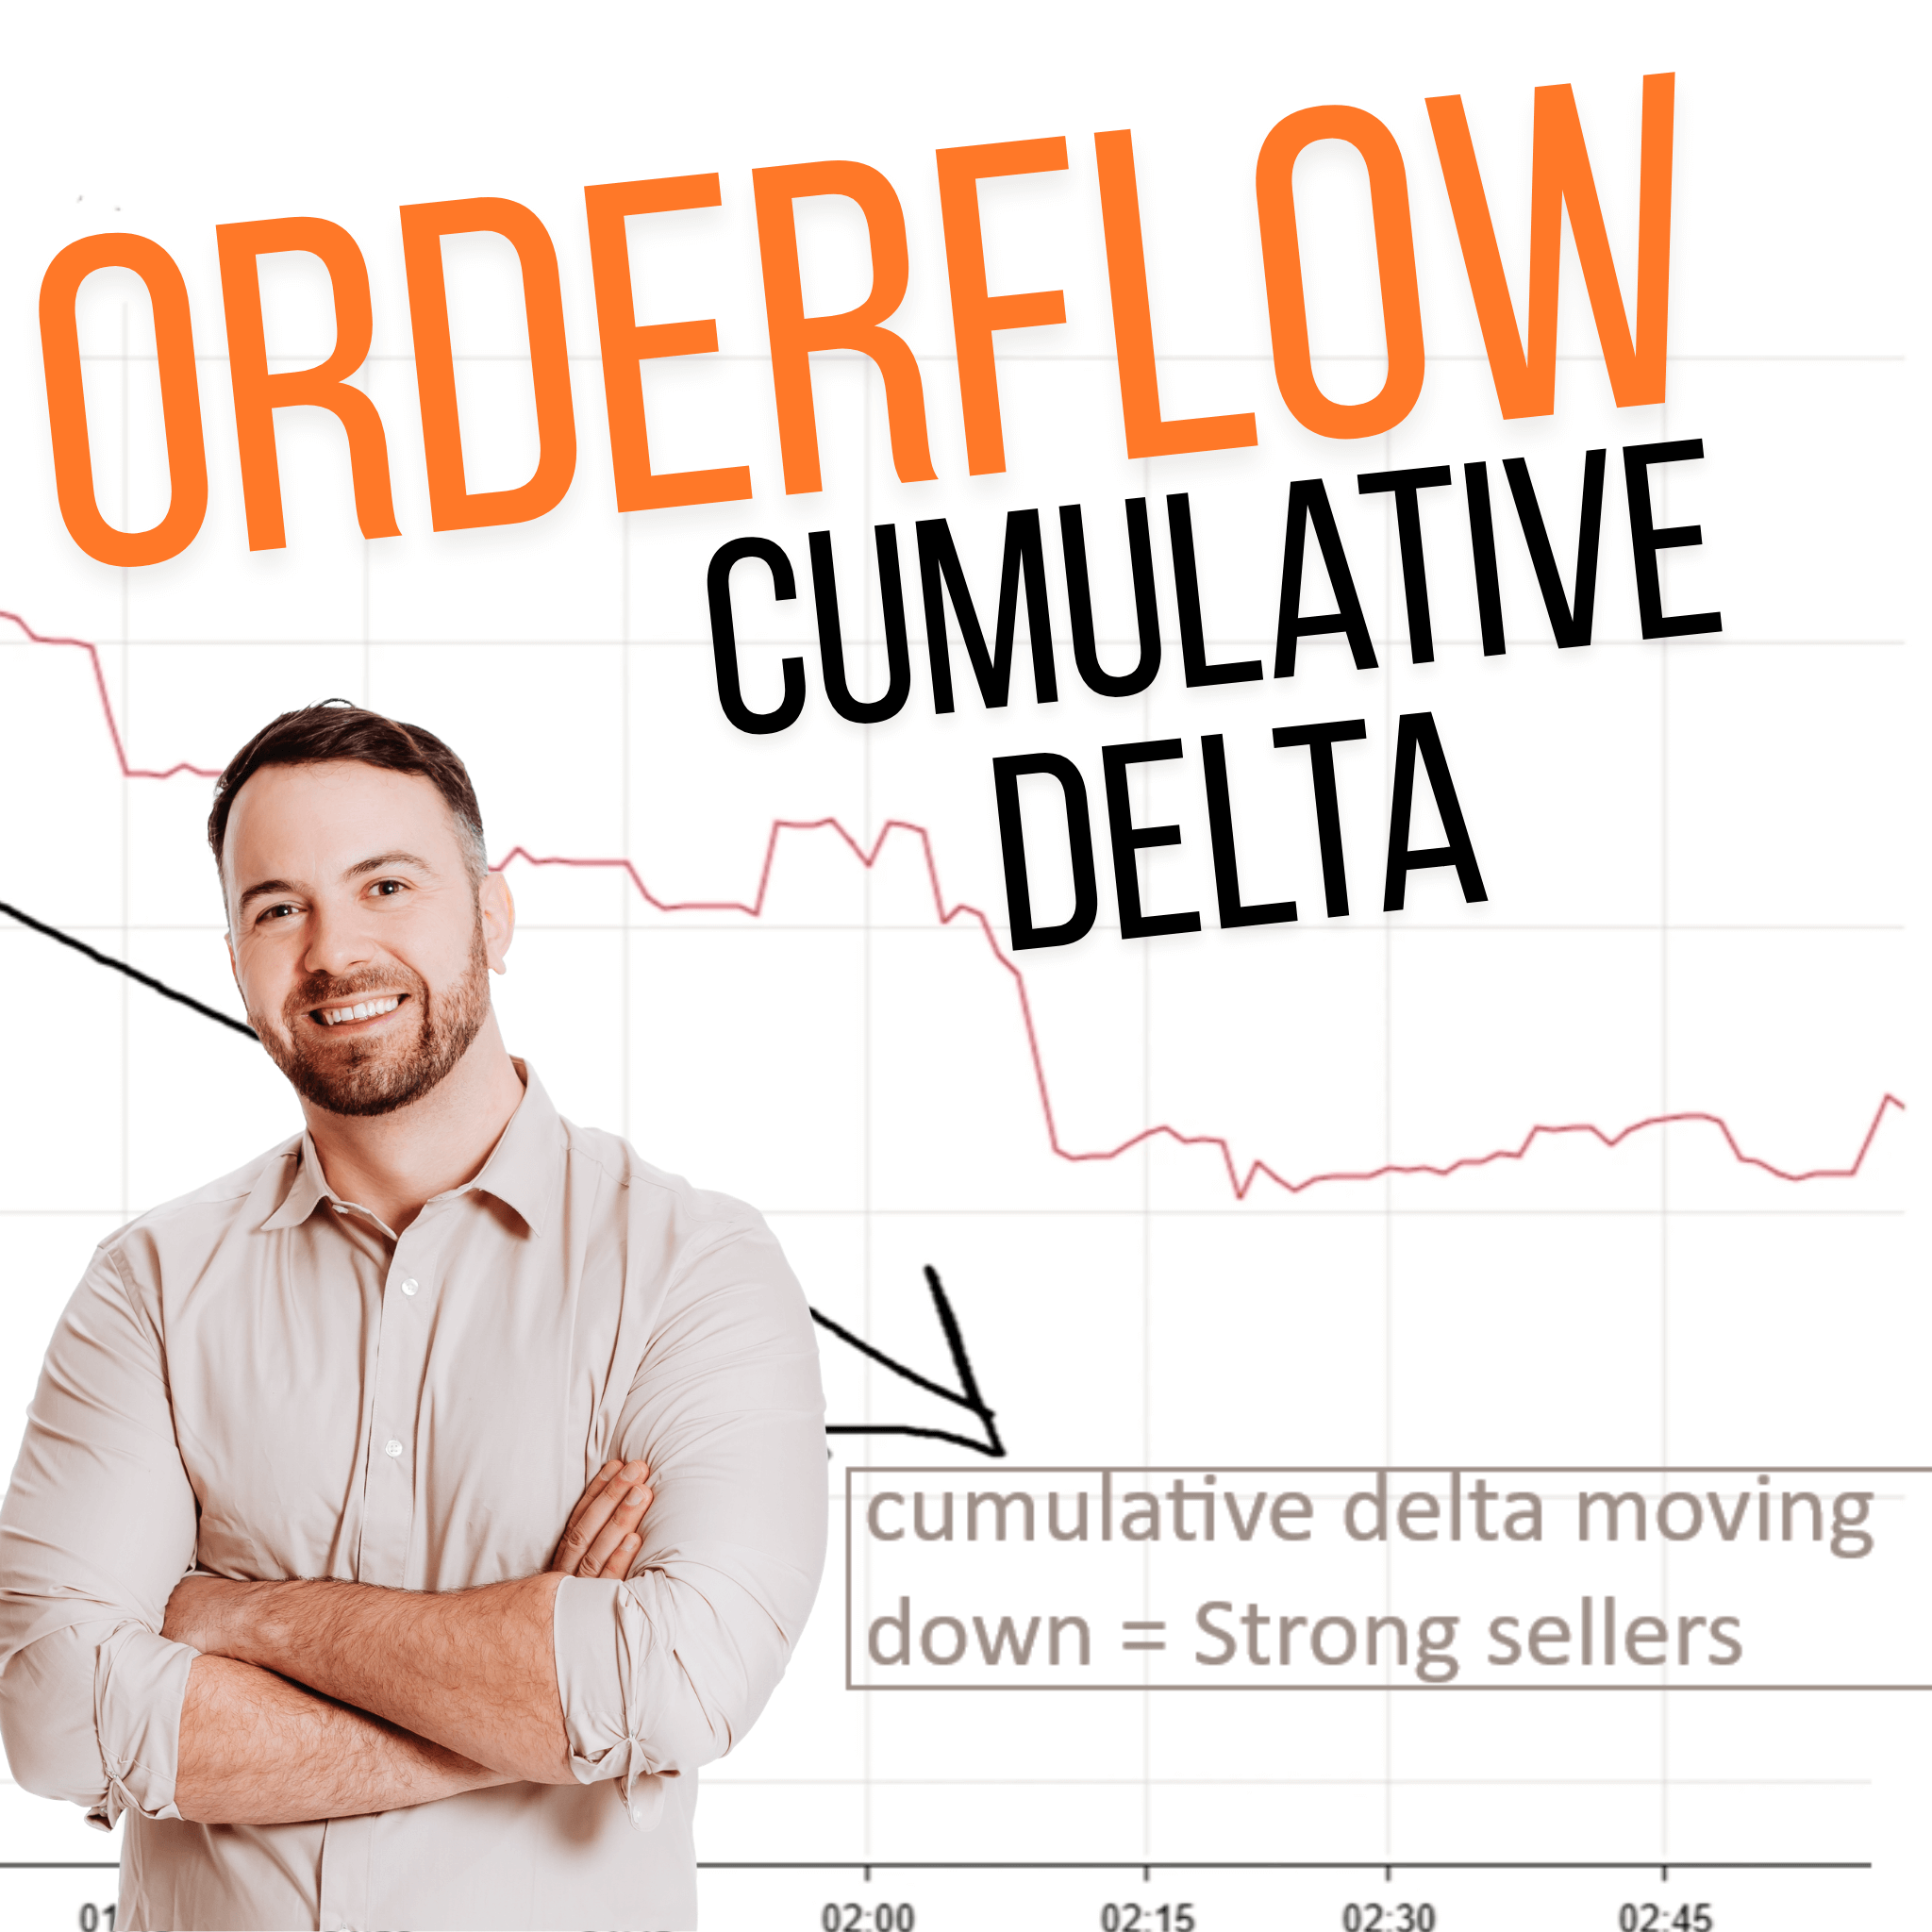
The tool that changed everything for me was Cumulative Delta. It’s essentially an X-ray for the market — it shows you the buying and selling pressure happening beneath the price candles, so you can see reversals forming before they actually happen.
In this article I’ll show you exactly what Cumulative Delta is, how to read divergence signals, and how I use it on real trades — including three live examples from Euro, AUD, and ES Futures.
Table of Contents
Summary of the Article
- Cumulative Delta tracks aggression: It shows the running net total of aggressive buyers vs. sellers throughout the day — not just price, but the force behind price.
- Divergence is the signal: When price makes a new low but Delta is rising (or vice versa), a reversal is highly probable.
- 1-minute chart is best: The more granular the timeframe, the earlier you catch the divergence forming.
- Works on futures, not spot forex: You need centralised tick data — CME-traded instruments like 6E, 6A, ES, NQ, GC, CL.
- Use it as confirmation, not a standalone signal: Delta divergence at a Volume Profile level is far stronger than Delta alone.
What is Cumulative Delta? (The Simple Definition)
Every trade is a battle between buyers and sellers. Delta is the score of that battle at a given moment. If 100 contracts are bought at market and 50 are sold, the Delta for that bar is +50. Cumulative Delta adds those scores up throughout the session — creating a running total that shows whether buyers or sellers have been more aggressive overall.
Most of the time, price and Cumulative Delta move together. When price goes up, Delta goes up. When they stop moving together — that’s where the opportunity is.
The key word here is aggressive. We’re tracking market orders — the traders who want in right now and are willing to pay the asking price. Passive traders use limit orders and wait. Aggressive traders use market orders and move prices. Cumulative Delta only tracks the aggressive side, because that’s what actually shifts the market.
When you see Delta rising while price is dropping, it means aggressive buyers are absorbing the sell orders at that level. The price hasn’t moved yet — but the buying pressure is already there. That’s your edge: you see the reversal forming before the candles show it. This is especially powerful when combined with Volume Profile levels — the two together give you both the where and the why.

The Secret of Divergence: When Price and Delta Disagree
Divergence is the core concept. It happens when price moves in one direction but Cumulative Delta moves in the opposite direction. This mismatch is a warning sign — it tells you the price move isn’t supported by aggressive participation, which means it’s likely to reverse.
This is the most powerful signal in order flow trading because it reveals hidden weakness or strength that you simply can’t see on a price chart alone. Roughly 95% of retail traders miss it entirely because they only watch candles.
Bullish Divergence (The Buy Signal)
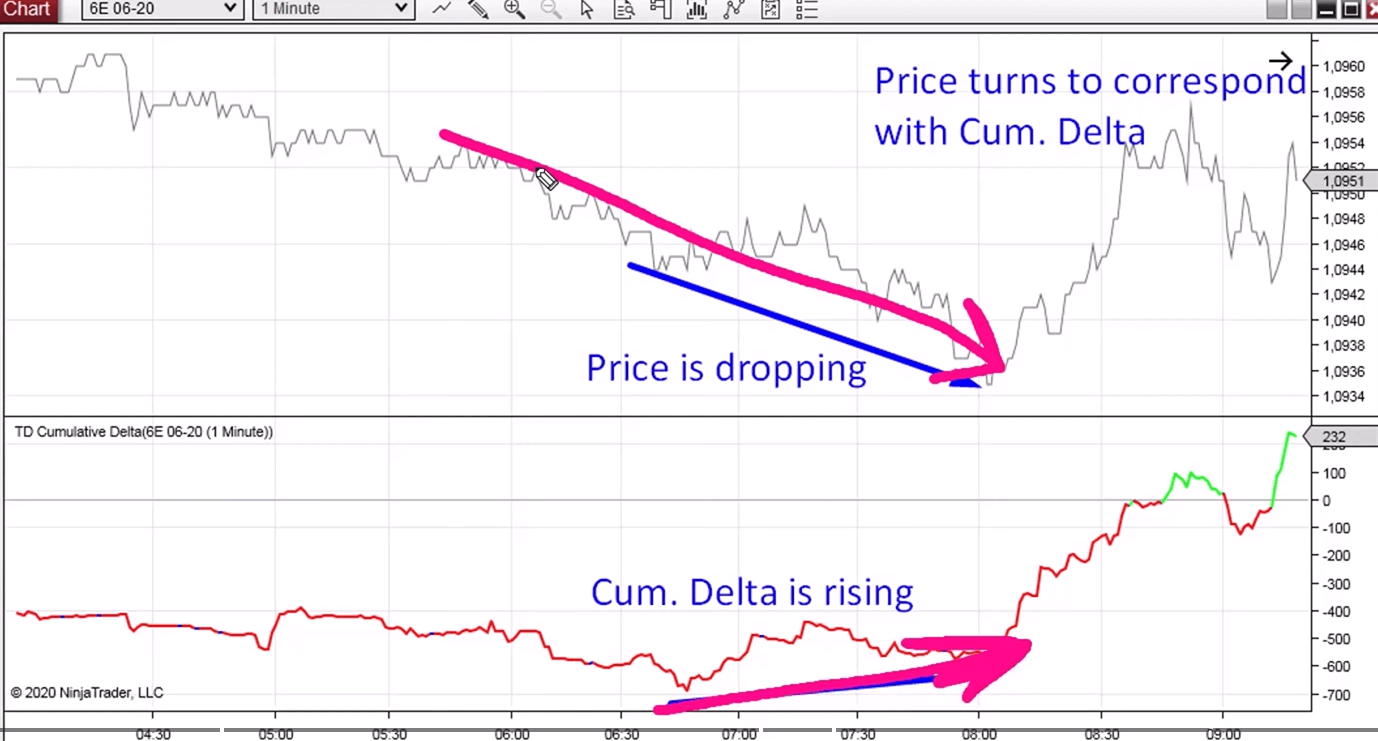
Price makes a new low — it looks weak, and most traders are scared to buy. But you look at your Cumulative Delta and the line is rising. That’s bullish divergence.
What it means: even though price is dropping, more people are aggressively buying than selling. The “big fish” are absorbing sell orders with large buy limit orders, or they’re hitting the market with buy orders as price dips — positioning for the reversal before it happens.
The result: price snaps back and follows Delta upward. This setup often appears minutes before a large green candle. You’re entering as institutions are loading up, not after the move has already run.
Bearish Divergence (The Sell Signal)
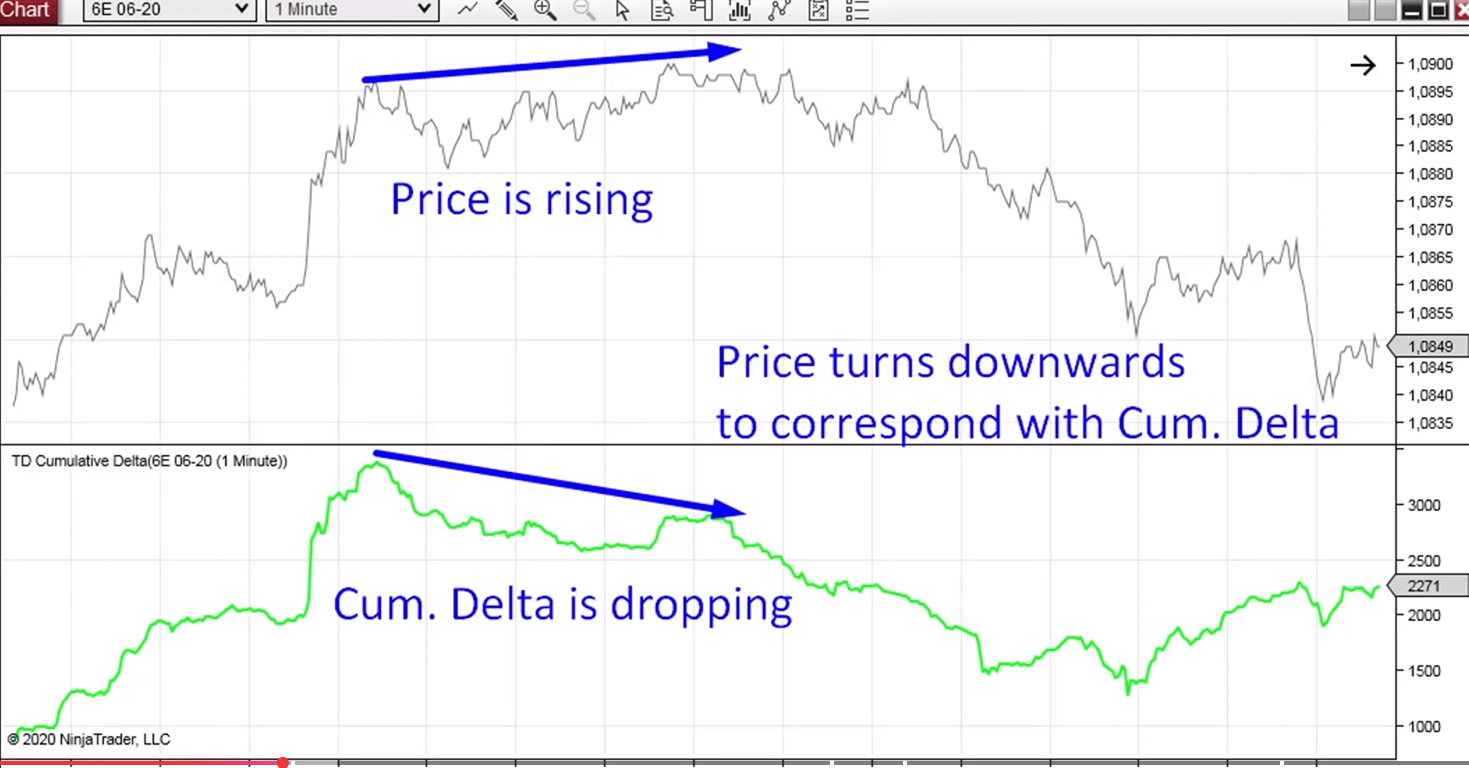
Price is climbing but Cumulative Delta is dropping. That’s bearish divergence — and it’s a signal that the upward move is exhausted or fake.
What it means: even as price ticks higher, the net volume of aggressive orders is negative. Buyers are losing steam. Aggressive sellers are quietly loading short positions at the high, preparing to push price down hard.
The result: price turns down to “catch up” with Delta. Instead of buying the top, you can short the market right as institutions begin their move. This is what professional trading looks like — you’re not guessing, you’re reading the actual order flow.
Divergence works because price is a lagging indicator of intent. Intent shows up in the orders first. When Delta diverges from price, it’s a “warning shot” — the current trend is no longer supported by aggressive participants. Without fresh aggressive orders to continue pushing, price has nowhere to go but the opposite direction. In professional trading we call this exhaustion or absorption.
The practical benefit: tighter stop-losses and higher reward-to-risk ratios. When you enter on a confirmed Delta divergence at a key level, you know institutions are already positioned on your side. You don’t need a wide stop to protect against uncertainty — the Delta is confirming the setup before you click the button.
How to Set Up Your Charts for Success
To catch divergence in real time, I use a 1-minute price chart synced with a 1-minute Cumulative Delta chart. Why 1-minute? Because Delta is a sensitive tool — it tracks individual market hits. On a higher timeframe like 1-hour, the data gets smoothed and you lose the 5-minute window where the reversal is forming. The 1-minute gives you the micro-view you need.
My setup is simple:
- Top window: 1-minute price candles. I use 5-minute or 15-minute charts for the big picture, but I execute on the 1-minute.
- Bottom window: Cumulative Delta set to “Daily Reset” — resets to zero at market open so you see the net sentiment for today’s session without yesterday’s data bleeding in.
- Synced crosshair: When I hover over a price candle, the Delta bar below highlights simultaneously. This lets me say “at 10:05, price went down but Delta went up.”
One important note: you need proper tick data — Level 1 or better from Rithmic or CQG. Free platforms like TradingView use tick count, not actual contract volume. That’s not Cumulative Delta — that’s just noise. For this to work properly, you need real bid/ask data from the exchange.

Once your charts are synced, you’re looking for swing highs and swing lows. When price creates a new low but the Cumulative Delta low is higher than the previous Delta low — that’s your potential entry. The price is making a lower low, but the buying aggression is actually increasing. That gap between price reality and Delta reality is the divergence signal.
Keep the charts clean. Price and Delta. That’s it. The beauty of this approach is its simplicity — two lines telling you when the market is lying to you.
Three Real Trade Examples Using Cumulative Delta
I don’t teach theory in isolation — I show it on real charts. Here are three examples from the video, all using Cumulative Delta to confirm price reversals at key levels.
Example 1: Euro Futures (6E) — Bullish Divergence at Volume Profile Support
I had two strong support zones identified on the Euro futures using Volume Profile — areas where heavy trading had occurred in the past. As price approached the first support, it was dropping fast and aggressively. To any standard chart reader, this looked like a short opportunity. The candles were red, momentum was down.
But the Cumulative Delta was rising while price was falling. Classic bullish divergence. Aggressive buyers were absorbing the selling pressure right at that Volume Profile level. I entered long exactly as price touched the level. Price bounced for a clean 20-pip gain.
Without the Delta, I would have been too nervous to buy into a fast downward move. The Delta gave me the conviction — I could see the buyers were already in position before the price turned.

Example 2: Australian Dollar Futures (6A) — Exhaustion at the Daily High
Many traders use daily highs as resistance levels, and rightly so. On the AUD futures, price was rushing toward the High of the Day. A fast move toward a high usually suggests a breakout is coming — which would get a lot of retail traders clicking the buy button.
Instead of guessing, I checked the Delta. As price hit the high, Delta stayed flat and then started dropping. The buyers were hitting the market with buy orders, but price wasn’t going higher — because large sell limit orders were sitting right there absorbing them. The buyers ran out of energy. Sellers took control. Price followed Delta downward significantly from that resistance level.
This is what I mean by using Delta as a “confirmation filter.” Without it, that daily high looked like a breakout. With it, it was clearly an exhaustion point — and I was on the right side of the trade.

Example 3: ES Futures (S&P 500) — Divergence at a Key Intraday Level
The ES (S&P 500 futures) is the most liquid market in the world for order flow — the volume is massive, and Delta signals are extremely clear. In the third example from the video, price was testing a key intraday support level. The candles looked weak and choppy, the kind of price action that makes most traders step back and wait.
But the Cumulative Delta was building a clear bullish divergence — each swing low in price was matched by a higher swing low in Delta. The aggressive buying pressure was increasing even as price wobbled. I entered long with a tight stop just below the level, and price turned sharply higher as the Delta had been signalling for several minutes.
This example shows why ES is one of the best markets for this technique. The volume is high enough that the Delta signal is reliable, and the institutional activity at key levels is very visible. For the full walkthrough, jump to 11:56 in the video above.
Warning Signals: When NOT to Trade
One of the best uses of Cumulative Delta is as a filter — to keep you out of bad trades, not just get you into good ones.
Here’s the rule: if price is approaching a support level and you want to buy, but the Cumulative Delta is also dropping sharply — do not take the trade. That’s not divergence. That’s convergence. Price is falling and aggressive sellers are pushing it lower. There’s no sign of buyers absorbing anything. The level is likely to break.
I’ve seen traders blow accounts trying to “buy the support” while the Delta is screaming that sellers are completely in control. The discipline to sit on your hands when the Delta doesn’t confirm — even when the price level looks perfect — is what separates professionals from gamblers. If the effort (Delta) matches the result (price direction), the trend is real. If they diverge, a reversal is coming. If they’re both heading the same way down, stay out.
Cumulative Delta Decision Framework
Here’s the simple framework I use every time I consider a trade at a key level:
- Price drops to support + Delta rising → BUY. Bullish divergence. Aggressive buyers are absorbing the sell pressure. This is the highest-probability long setup in order flow trading.
- Price rises to resistance + Delta falling → SELL. Bearish divergence. Aggressive sellers are loading up at the high. The move is exhausted.
- Price drops to support + Delta also dropping → STAY OUT. No divergence. Sellers are in full control. The level is likely to break.
- Price rises to resistance + Delta also rising → STAY OUT. Buyers are still pushing. A breakout is possible. Wait for Delta to turn before fading the move.
The middle two scenarios — where Delta confirms the price move rather than diverges from it — are where most retail traders get destroyed. They see a level and buy it without checking the Delta. They get steamrolled by an institutional move that the Delta was clearly telegraphing.
This filter alone — simply not taking trades where Delta confirms the trend against you — can dramatically improve your win rate. You’ll take fewer trades, but the ones you do take will have much higher probability. That’s professional trading: patience over frequency.
Best Markets for Cumulative Delta
I get asked constantly: “Can I use Cumulative Delta for spot Forex?” The answer is no — and it’s important to understand why.
Spot Forex is decentralised. There’s no central exchange that records every trade globally. What you get from a Forex broker is tick volume — a count of price changes, not actual contract numbers. That’s not Cumulative Delta; it’s just a noise indicator.
For this to work, you need centralised markets with real tick-by-tick bid/ask data:
- Currency Futures (6E Euro, 6A AUD, 6B GBP): The “professional” way to trade Forex. All traded on the CME — full tick data, real Delta signals.
- S&P 500 & Nasdaq Futures (ES, NQ): The most liquid order flow markets in the world. Delta signals here are extremely clean.
- Gold & Oil Futures (GC, CL): Very sensitive to institutional moves. Delta works beautifully during the New York session.
- CME Bitcoin Futures: Provides centralised institutional data that spot crypto exchanges can’t replicate.
For the platform, I use NinjaTrader with a proper order flow setup. You also need a quality data feed — Rithmic or CQG — to ensure you’re capturing every tick from the exchange. Without that, the signals won’t be accurate.
Conclusion
Cumulative Delta is the closest thing I’ve found to seeing the market’s “intent” before it shows up in price. Once you learn to read divergence, you stop reacting to candles and start anticipating moves. You enter when institutions enter, not after the move has already run.
The core principle is this: price is the result, Delta is the cause. Follow the cause, and the results take care of themselves. It takes time to train your eyes to read the divergence in real time — but once you do, you’ll never want to trade without it again.
If you want to go deeper on order flow combined with Volume Profile, that combination is the foundation of everything I teach. And if you want to put these skills to work on a funded account, check out the Funded Trader Academy — I’ll show you how to apply all of this in a structured prop firm programme.
You can see all three trade examples walked through step-by-step in the video above. Jump to 4:10, 8:58, and 11:56 for each one respectively. The visual charts make the divergence patterns much easier to understand than any written description.
FAQ: Frequently Asked Questions
Regular volume tells you how much was traded. Cumulative Delta tells you who was more aggressive — buyers or sellers. It tracks the running net total of aggressive market orders (buyers hitting the ask vs. sellers hitting the bid) throughout the session. When the Delta line is rising, buyers are in control. When it’s falling, sellers are. Regular volume gives you quantity; Delta gives you direction and intent.
Divergence means price and Delta are telling different stories. If price makes a new low but Delta is rising, it means aggressive buyers are absorbing the selling — a bullish reversal signal. If price makes a new high but Delta is falling, buyers are exhausted and sellers are quietly loading up — a bearish reversal signal. Divergence is essentially the market showing its hand before the price candles catch up.
No. Spot Forex is decentralised — there’s no central exchange capturing every trade globally. What brokers call “tick volume” is just a count of price changes, not actual bid/ask trade data. For Cumulative Delta to work, you need centralised tick data from an exchange like the CME. This means trading currency futures (6E for Euro, 6A for AUD, etc.) rather than spot Forex. The good news is that currency futures move almost identically to spot pairs — you just get real data.
The 1-minute chart gives you the most detailed and timely divergence signals for intraday trading. Higher timeframes smooth out the data and you lose the narrow window where the reversal is forming. For swing trading you can use 5-minute or 30-minute charts, but precision decreases. For day trading entries, the 1-minute is the standard — it shows you the exact bar where buyers or sellers start taking control at a key level.
It’s one of the very few leading indicators in trading. Because it tracks the aggressive orders that cause price changes, the Delta often shows a reversal forming before the price candles actually turn. When Delta diverges from price, you’re seeing the buying or selling pressure build up in real time — before that pressure has moved price yet. That early signal is the entire edge of this approach.
Yes — Cumulative Delta can give false readings, most commonly near major news events or in very low-liquidity conditions. The most reliable way to filter false signals is to require confluence with a Volume Profile level. If the Delta divergence is forming at a high-volume node or Point of Control, the probability of a genuine reversal is significantly higher than if it’s forming in a low-volume area where price can move easily. Never trade a Delta signal in isolation — always ask whether the level underneath the signal has structural significance.
This is where the real edge is. Volume Profile shows you where institutions built positions historically — the high-volume nodes and Point of Control. Cumulative Delta shows you in real time whether buyers or sellers are dominant at those levels right now. The ideal setup: price returns to a significant Volume Profile level, and you watch the Cumulative Delta for a divergence. If price is pushing into a volume node (support) but Delta is rising — buyers absorbing the selling — that’s confirmation the level is likely to hold. The two tools answer different questions: Volume Profile says ‘this level matters,’ Cumulative Delta says ‘here’s what’s actually happening at it.’