Order Flow is one of the most powerful tools available to intraday traders. It gives you a window into what is actually happening in the market — not just where price moved, but where the real buying and selling took place. When you learn to read it well, it changes how you see every chart.
But here is the thing: most traders who pick up Order Flow end up making the same set of mistakes. They over-read charts, skip the context that makes Order Flow meaningful, or try to use it in situations where it simply does not apply. These common Order Flow trading mistakes quietly drain performance, often without the trader even knowing where things went wrong.
In this article, I am going to walk you through the six most common Order Flow trading mistakes I see traders make. For each one, I will explain exactly why it hurts your trading, show you what to look at instead, and give you practical steps to correct it. Whether you have been using Order Flow for years or are just getting started, at least one of these will resonate with you. Let us get into it.
Table of Contents
Mistake 1 — Over-analyzing every footprint
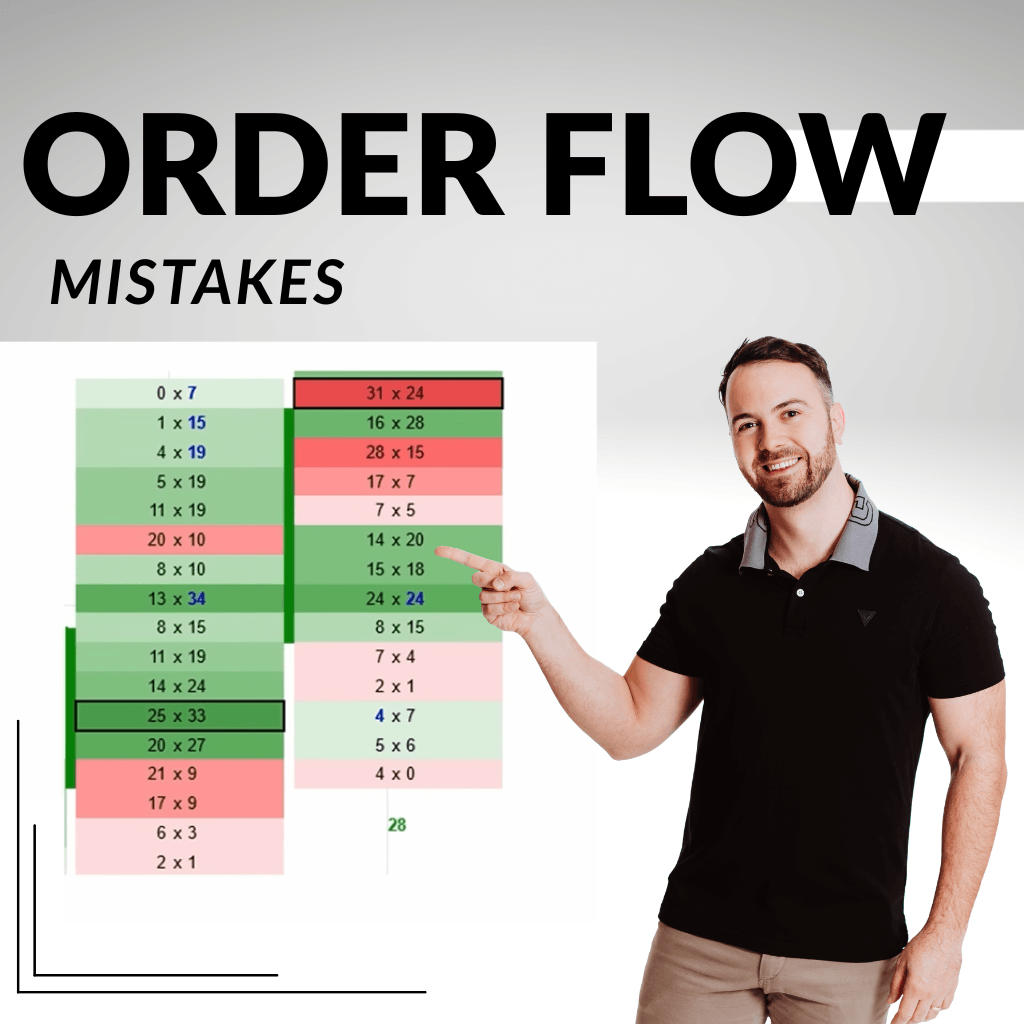
The footprint chart is full of numbers. Every cell shows you how many contracts traded at each price level on both the bid and the ask. For a new Order Flow trader, this can feel like having access to everything — and so the natural response is to try to read everything.
That is exactly where the problem starts.
When you try to analyze every single number on the footprint, you end up in analysis paralysis. The chart stops being useful and starts being noise. You hesitate, second-guess entries, and often miss the actual move while you are still reading the details.
What to focus on instead
The footprint chart is most useful when you filter your attention to the things that actually matter. Here is a simple framework for what deserves your attention:
Signal | What it tells you | Why it matters |
Heavy volume zones | Where large amounts of contracts traded | These act as support and resistance |
Delta | The difference between buying and selling volume | Shows whether buyers or sellers are in control |
Imbalances | Cells where one side dominated the other heavily | Represents trapped traders — price often revisits |
Stacked imbalances | Multiple imbalances aligned vertically | Strong support or resistance zones |
Think of it this way: imagine you are trying to read a newspaper but instead of reading the headlines, you try to read every single word on every page at once. You would not absorb any useful information — you would just feel overwhelmed. The footprint chart works the same way. Train your eyes to go to the headlines first.
A useful habit: before placing any trade, ask yourself — ‘What is the dominant volume cluster telling me? What is the delta doing? Are there imbalances nearby?’ If you can answer those three questions clearly, you have enough information to make a decision.
This kind of focused reading also makes you faster. Decisions happen quickly in intraday trading. The traders who consistently perform well are not the ones who analyze the most — they are the ones who identify the right signals quickly and act with confidence.
Mistake 2 — Ignoring the big picture
This mistake is closely connected to the first one. Once traders discover how much detail is available in the footprint chart, they often zoom all the way in — and never look up. They get so focused on the one-minute or tick chart that they forget to check what the market is doing at a higher level.
This is a serious problem. Order Flow detail is only meaningful in context. A large imbalance in the footprint might look like a strong rejection signal — but if you are sitting in the middle of a strong trending move on a larger time frame, that same imbalance may simply be noise.
How to build your big-picture context
Before you dive into Order Flow, you need to answer a few questions about the market at a larger scale. Is price currently trending or rotating? Where are the major volume levels from the weekly structure? Where are the significant support and resistance zones that the bigger participants are watching?
A practical setup for this is to keep a separate chart visible at all times — a 30-minute chart with the weekly Volume Profile overlaid on it. This gives you a view of where the market has been trading over the past week, where the high-volume nodes are sitting, and what direction the overall flow has been heading.
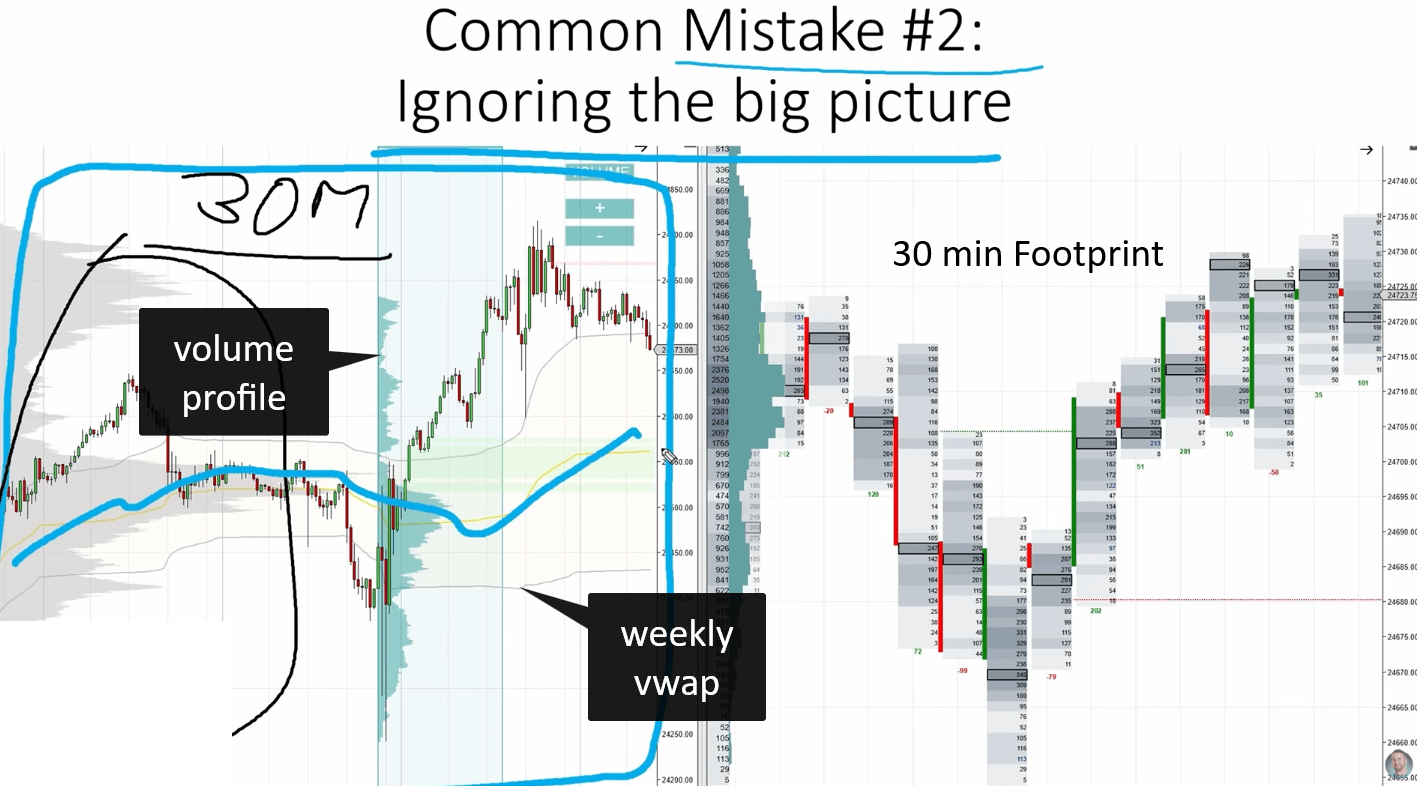
You can also use a 30-minute footprint chart for this purpose. Even though footprint charts are typically used on shorter time frames, a 30-minute footprint still shows you the major volume clusters and the overall structure — while giving you a broader view than a 1-minute chart would.
A two-screen setup works well here: keep your big-picture chart on one screen and your detailed Order Flow chart on the other. If you only have one screen, use a split layout. The context screen should always be visible before you enter a trade.
Once you have the big picture clear, the Order Flow detail on the shorter time frames becomes far more useful. You are no longer reading signals in isolation — you are reading them in the context of what the whole market is doing, which is where the real edge lives.
Mistake 3 — Misunderstanding bid and ask
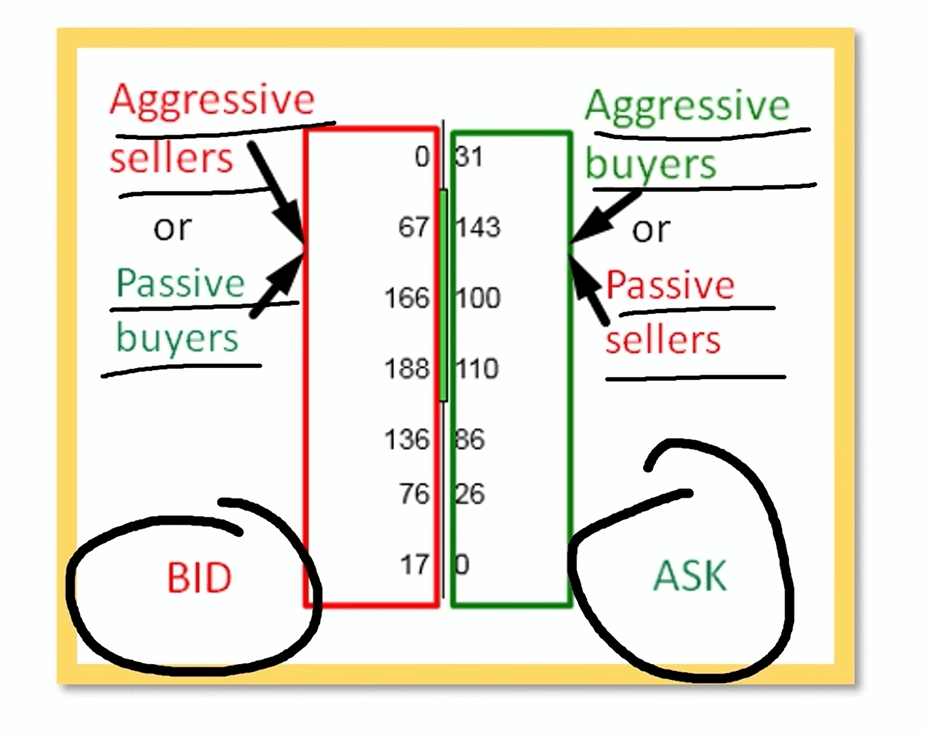
This is one of the most fundamental misunderstandings in Order Flow trading, and it trips up traders at every level. On the surface, bid and ask sound simple: the bid is where buyers are, and the ask is where sellers are. But this is not quite accurate — and the difference matters a great deal when you are reading footprint data.
Here is the correct way to understand it:
Side | Aggressive participant | Passive participant |
Bid | Aggressive seller (market sell order) | Passive buyer (limit buy order) |
Ask | Aggressive buyer (market buy order) | Passive seller (limit sell order) |
Why does this matter? Because when you see a large number on the bid side of the footprint, you cannot automatically conclude that selling pressure is dominating. That volume could represent large passive buyers absorbing sell orders at that level. The footprint alone shows you the executed volume — it does not tell you the intent behind it without additional context.
This is exactly why a single footprint bar should never be read in isolation. You need to combine what you see at the bid and ask with the delta, the price reaction afterward, and the surrounding volume structure to build an accurate picture.
A quick mental check before reading any footprint cell: ‘Is this volume from someone hitting the market aggressively, or from someone sitting and absorbing?’ The answer changes your interpretation entirely.
Getting this concept right is not optional — it is foundational. If your understanding of bid and ask is incorrect, every interpretation you build on top of it will also be off. Take the time to practice this distinction until it becomes second nature.
Mistake 4 — Using Order Flow for swing trading
This is one of the most frequently asked questions in the Order Flow community: can I use Order Flow for swing trading? The honest answer is no — and understanding why will save you a great deal of frustration.
Order Flow is designed for short-term, intraday analysis. It reads the activity of participants who are active within a session — scalpers, intraday algorithms, and short-term momentum traders. These participants create the volume clusters, imbalances, and delta signals that make Order Flow useful. Over longer time frames, that intraday noise becomes irrelevant to the bigger moves that swing traders are trying to capture
Which time frames work with Order Flow?
A straightforward way to think about this: Order Flow works on tick charts and on time-based charts up to the 30-minute frame. Beyond that, the signals lose their meaning.
Time frame | Order Flow useful? | Better tool |
Tick charts | Yes | Order Flow |
1-minute to 30-minute | Yes | Order Flow |
1-hour | No | Volume Profile |
4-hour | No | Volume Profile |
Daily and above | No | Volume Profile |
For swing trading, Volume Profile is the right instrument. It shows you where the market has spent the most time and traded the most volume over a longer period — which is exactly what swing traders need to identify meaningful levels.
Using the wrong tool for the job does not just fail to help you — it actively misleads you. An Order Flow signal on a 4-hour chart does not represent institutional activity in the way that the same signal on a 5-minute chart does. The participants are different, the context is different, and the interpretation has to be different too.
Mistake 5 — Trading too many markets
It feels logical: if you trade more markets, you will have more opportunities, and more opportunities should mean more winners. In practice, this logic does not hold. Spreading your attention across too many markets with Order Flow almost always leads to worse results, not better ones.
The reason comes down to specialization. Every market has its own personality — its own typical volume levels, its own volatility patterns, its own reaction times, and its own quirks in how price behaves around key levels. These differences are not small. They are large enough to completely change how you should read Order Flow signals.
How different are the markets really?
Take a look at the numbers below. These represent approximate values, but the contrast speaks clearly:
Market | Avg. daily volatility | Avg. daily volume |
Crude oil (CL) | ~7% | 1,000,000+ contracts |
Euro futures (6E) | ~0.5% | ~150,000 contracts |
E-mini S&P 500 (ES) | ~1-2% | ~1,500,000 contracts |
The footprint chart on crude oil will look nothing like the footprint chart on Euro futures. What counts as ‘heavy volume’ on one instrument is completely different from what counts as heavy on another. If you are waiting for an absorption signal before entering a trade, the way that absorption looks in crude oil is completely different from how it looks in Euro futures. Without experience in a specific market, you risk misreading these signals constantly.
What the data says about specialist traders
There is a compelling piece of evidence on this point. A survey conducted by one of the top proprietary trading firms found that the top 6% of traders — the group responsible for 43% of total payouts — were trading only one market. Read that again: the best-performing traders were also the most focused ones.
This is not a coincidence. Knowing one market deeply — its rhythms, its typical volume behavior, how it reacts to news, what its absorption looks like — is a genuine edge. You build that edge through repetition in a single market, not by spreading across ten.
The practical recommendation is straightforward: pick one or two markets and commit to them. Get to know what normal looks like. Learn how the footprint moves during different sessions. Understand the typical delta behavior. Over time, you will develop an intuition for that market that cannot be built any other way.

Mistake 6 — Thinking you need Level 2 data
A persistent belief in the trading community is that serious Order Flow analysis requires Level 2 data. Traders see the Depth of Market (DOM) feed with all its pending orders and assume that adding this information will give them a more complete picture. In reality, Level 2 data introduces more confusion than clarity for most Order Flow traders — and here is why.
Level 1 vs Level 2 — what is the actual difference?
Data type | What it shows | Is it real intent? |
Level 1 (Order Flow) | Executed trades — orders that went to the exchange | Yes |
Level 2 (DOM / Market depth) | Pending orders waiting to be filled | Not necessarily |
The key distinction is this: Level 1 data shows you what actually happened. A trade on the Level 1 feed represents real money that moved — a participant decided to buy or sell and that order executed. There is genuine intent and commitment behind it.
Level 2 data shows you pending orders. These orders are sitting in the order book, but they have not been executed yet. And here is the important part: they do not have to be. Pending orders can be cancelled at any moment. This is a well-known tactic used by certain algorithmic systems: place a large visible limit order to influence the perception of other traders, and then withdraw it the moment price approaches. These orders never trade — they were never meant to.
A large number in the DOM does not mean a large buyer or seller is actually going to trade there. It might be a manipulation signal designed to attract or repel price. Order Flow, by contrast, only records what actually happened.
This is not to say that the DOM is completely useless — experienced traders with specific strategies do make use of it. But for Order Flow analysis specifically, Level 1 data is what matters. It is based on real, executed transactions. You do not need Level 2 data to trade Order Flow well, and adding it without a clear understanding of how to interpret it is more likely to create confusion than to improve your results.

Final Thoughts
Order Flow is a genuinely useful tool — but only when it is used correctly. The six common Order Flow trading mistakes covered in this article are not rare edge cases. They are patterns that show up repeatedly, across traders at every experience level, on every kind of instrument.
The good news is that each of these mistakes has a clear fix. Stop trying to read every number on the footprint and focus on what actually signals something — volume clusters, delta, and imbalances. Keep a big-picture chart in front of you before going into detail. Understand bid and ask correctly. Use Order Flow only for the time frames where it works. Commit to one or two markets and learn them deeply. And trust executed Level 1 data over the noise of pending orders.
None of these fixes require a new strategy. They require a shift in how you approach the tool you already have. Apply them consistently and your Order Flow analysis will become sharper, faster, and more reliable. The traders who perform well with Order Flow are not the ones with the most complex setups — they are the ones who have mastered the fundamentals and stick to them.
Frequently asked questions
What is the best time frame to use Order Flow on?
Order Flow works best on tick charts and time-based charts from the 1-minute up to the 30-minute frame. For anything above 30 minutes, Volume Profile is the more appropriate tool because it reflects longer-term price acceptance and rejection zones rather than intraday participant activity.
Can I use Order Flow on stocks?
Order Flow can technically be applied to stocks, but it works best on highly liquid futures markets where volume data is centralized and complete. On stocks, volume data is fragmented across multiple exchanges, which makes footprint readings less reliable. Futures markets like crude oil, the E-mini S&P 500, and Euro futures are the most commonly used instruments for Order Flow analysis.
How long does it take to get good at reading Order Flow?
Most traders begin to feel comfortable reading the basic signals — volume clusters, delta, and imbalances — within a few months of consistent screen time. Developing a reliable feel for a specific market typically takes longer, often six months to a year of focused observation. Sticking to one market from the start significantly accelerates this learning process.
Want to learn Order Flow from start to finish?
The Order Flow course at Trader Dale covers the complete methodology — from reading footprint charts to building a consistent intraday process — with custom-built indicators included. Visit traderdale.com, click ‘Trading Course & Tools’, and scroll down to browse the courses.