
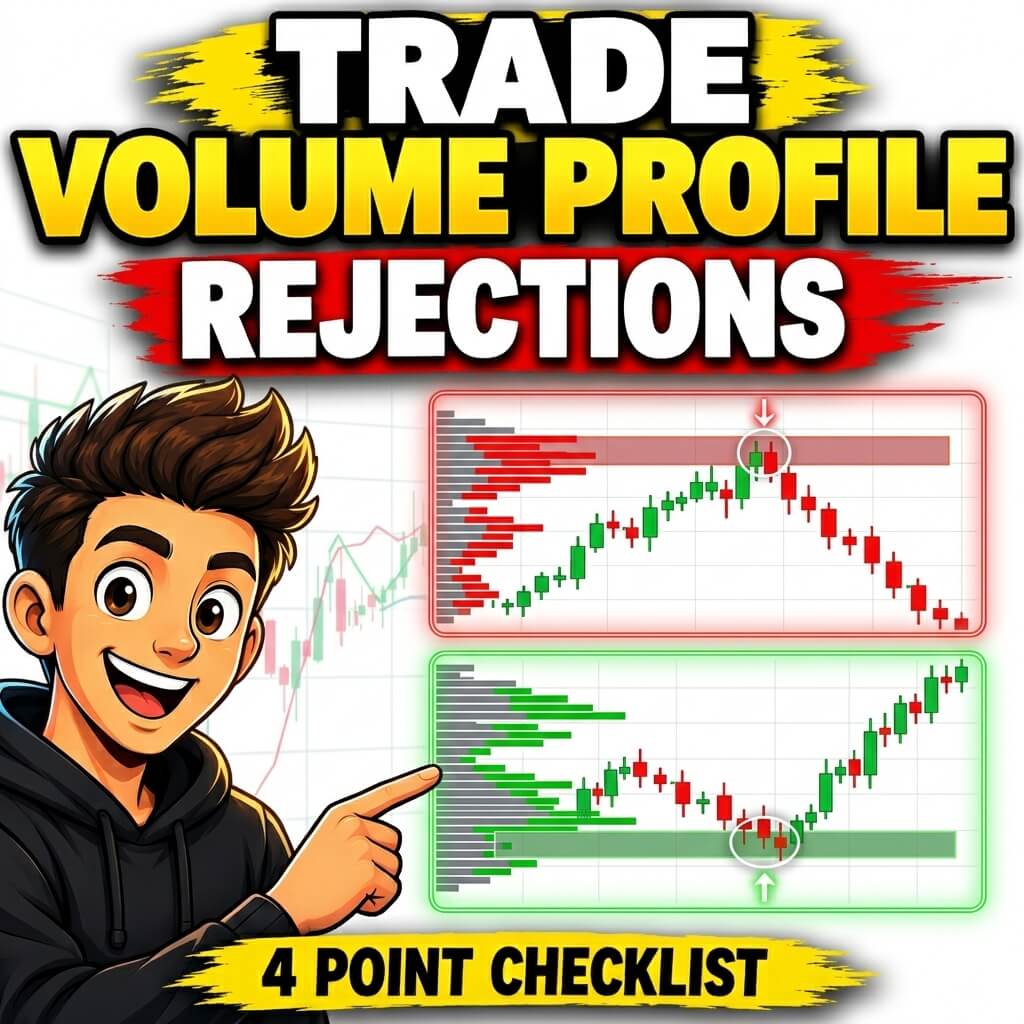
If you want to know how to trade Volume Profile rejections, this guide breaks it down into one simple checklist. Many traders see a strong high or a strong low on their chart and jump into a trade too fast. Then the price turns against them, and they wonder what went wrong. In this article, I draw on my years of experience reading price charts. I want to show you a calmer, more structured way to judge a rejection before you risk any money. There is no need to guess.
You will learn the four conditions that make a rejection worth trading. You will also learn why you do not always need every single one of them to line up. You will also see two full examples, one bearish and one bullish, walked through step by step. Each one is broken down piece by piece, so you can copy the exact same process on your own charts later today. By the end, you will know exactly how to trade Volume Profile rejections with a clear checklist in hand. No more guessing based on how a chart simply looks at first glance. No confusing jargon here. Just a practical, repeatable method you can start using the very next time you sit down to look at your charts.
Table of Contents
Summary in 5 Points
- To trade Volume Profile rejections, check four conditions: rotation, a strong rejection, well distributed volume, and a fair value gap.
- You do not need all four conditions. Three out of four is often enough to trade the setup.
- The real support or resistance zone is the heavy volume zone, not just the tip of the high or low.
- Wait for the price to pull back into that zone before entering your trade.
- A fair value gap that lines up with the heavy volume zone gives you extra confidence in the setup.
What Is a Volume Profile Rejection?
A Volume Profile rejection happens when the price pushes into a certain level and gets firmly pushed back. It leaves behind a clear high or a clear low on the chart. Think of it like a wall. The price tries to break through, fails, and bounces away. When you learn to trade Volume Profile rejections, this bounce is the very first thing you are looking for on your chart.
Why Rejections Matter on a Price Chart
Rejections matter because they show you where big buyers or big sellers stepped in with force. A weak, messy high does not tell you much. But a strong, clean rejection tells you that one side of the market pushed back hard against the other. This is useful information, because it hints at a level the market may respect again in the future.
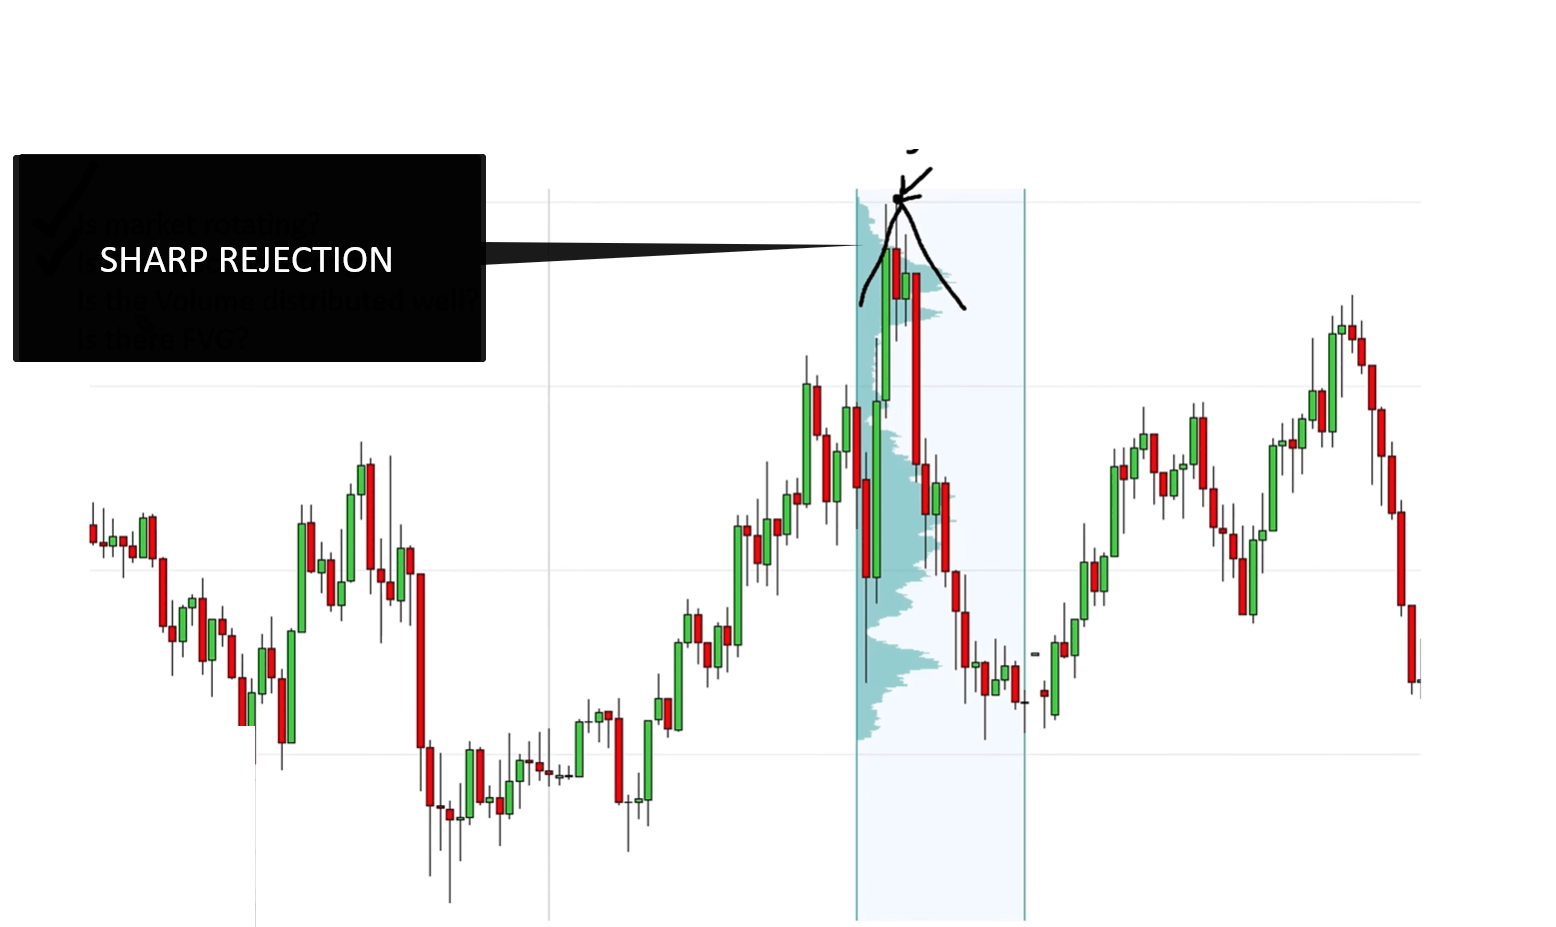
However, not every high or low is worth trading. Some rejections are weak. Others happen inside messy, choppy price action that gives no real edge at all. This is exactly why a checklist is so useful. Instead of guessing whether a rejection looks strong, you can run it through four clear conditions and get a straight answer. This turns a subjective decision into a repeatable process you can trust.
Once you get comfortable spotting rejections this way, you will start noticing them on almost every chart you open. You will feel far more confident deciding which ones are actually worth your time and your money. This is one of the biggest shifts that happens once a trader starts to seriously trade Volume Profile rejections with a plan. It replaces reacting to whatever candle happens to catch their eye that day. A clear process removes doubt, and doubt is often what causes traders to hesitate or overtrade.
The Four Point Checklist for Trading Volume Profile Rejections
Before you risk a single trade, run the setup through this simple four point checklist. It keeps your decisions consistent and stops you from trading random highs and lows just because they look interesting at first glance.
The Four Conditions Explained
Here are the four conditions to check when you want to trade Volume Profile rejections.
Checklist Point | What to Look For |
1. Market rotation | Price is moving up and down in a range before the rejection |
2. Strong rejection | A clear, sharp high or low, not a messy one |
3. Volume distribution | A heavy volume zone, with lighter volume above or below it |
4. Fair value gap | A gap showing aggressive buying or selling near the rejection |
The first point is rotation. Before a good rejection forms, the market should already be moving sideways, rotating up and down. This rotation shows that both buyers and sellers were active in that area. The second point is the strength of the rejection itself. Look at the high or the low. Is it sharp and obvious, or is it soft and unclear? A strong rejection stands out clearly on the chart.
The third point is volume distribution. Using the Volume Profile tool, check whether there is a clear heavy volume zone, with a lighter volume area just above or below it. This pattern shows where the real buying or selling pressure was concentrated. The fourth and final point is the fair value gap. This is a small gap in price that shows one side of the market moved with real aggression, leaving a visible imprint on the chart.
Why You Do Not Always Need All Four
Here is some good news. In trading, nothing is ever perfect, so you do not need every single condition to line up before you trade. If three out of the four conditions are met, that is still considered a strong setup worth trading. Of course, if all four line up cleanly, that is even better, and it gives you extra confidence. But do not wait around for a flawless, textbook example every single time. Learning to trade Volume Profile rejections with this flexible mindset will help you catch more valid setups. It keeps you off the sidelines, instead of waiting for a perfection that rarely comes.
Example One: Trading a Bearish Rejection
First, is the market rotating? Looking at the chart, price is clearly moving up and down before this rejection, so this point checks out. Second, is the rejection strong? There is a clear, sharp high on this candle, so yes, this is a strong rejection.
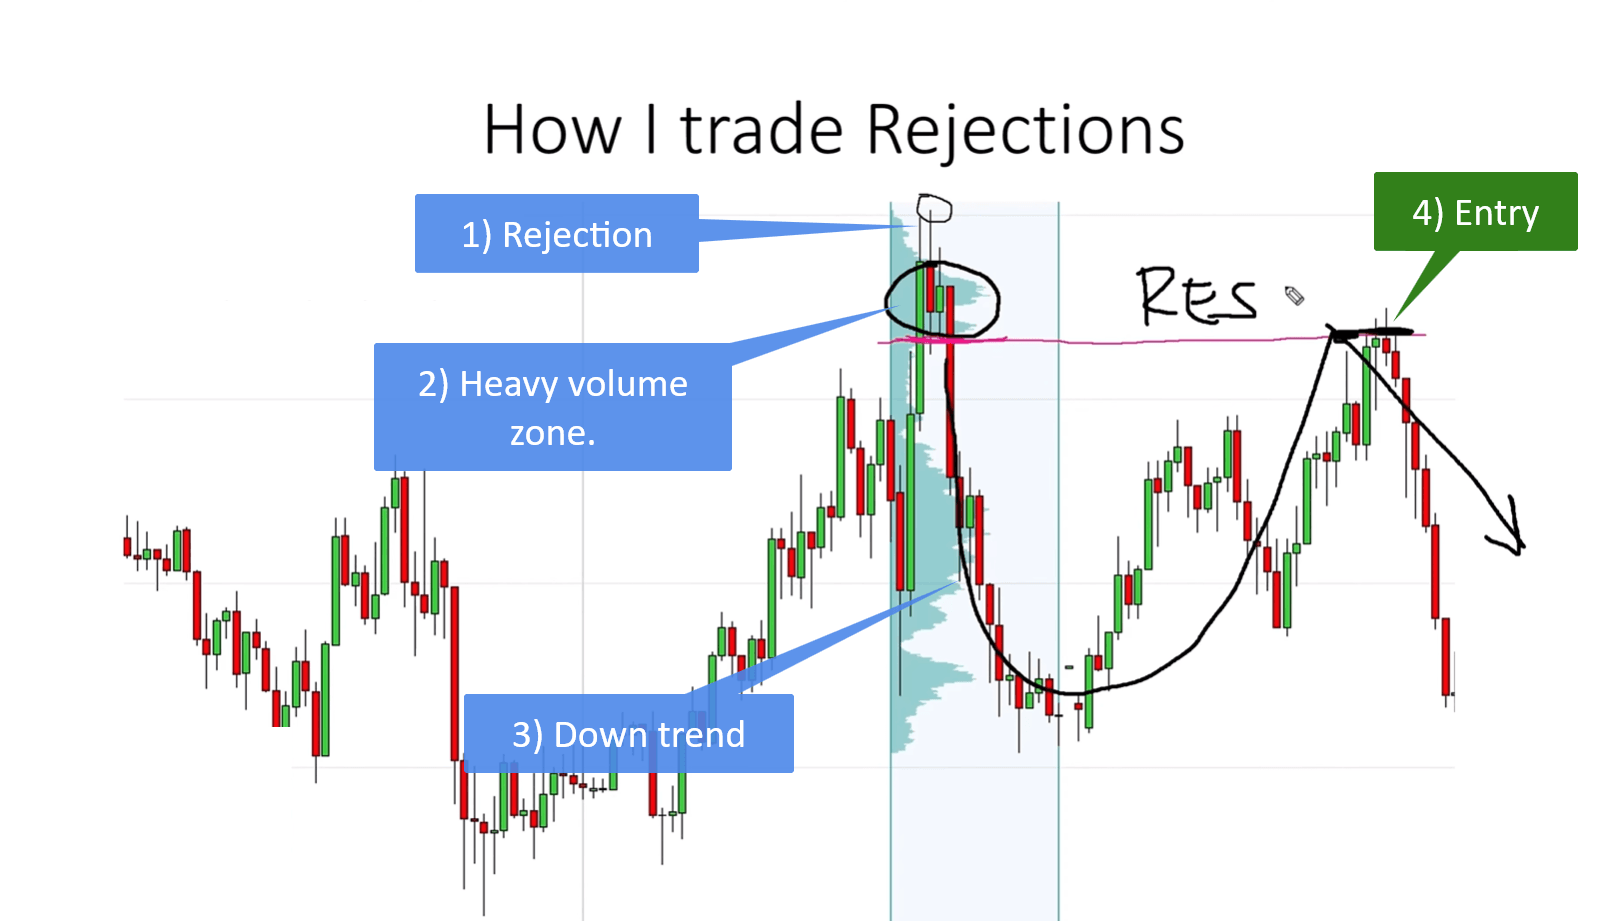
Third, are the volumes distributed well? Yes, there is a clear heavy volume zone, with a lighter volume zone sitting just above it. Fourth, is there a fair value gap? Yes, there is a visible gap here, showing the aggression of sellers as they pushed the price down. All four points check out on this example, which makes it a strong, high confidence rejection worth trading.
Entering the Short Trade
Once you confirm a good rejection, the next step is entry. You do not enter right at the top of the high. Instead, you wait for the price to pull back into the heavy volume zone, since this zone is the real resistance area. The resistance is not just a single price level. It is a full zone, and it usually begins right at the start of that heavy volume cluster.
Interestingly, the beginning of the heavy volume zone very often lines up closely with the start of the fair value gap. When both of these line up, you get a clean, well defined level to trade from. So the plan is simple. Spot the rejection and confirm it with the checklist. Wait patiently for a pullback into the heavy volume zone, then enter your short trade from the beginning of that zone.
Example Two: Trading a Bullish Rejection
Let us look at a second example, this time a bullish setup. Once again, before trading anything, we need to check whether this is a genuine rejection or simply a trap.
Checking the Checklist on the Long Setup
Is the market rotating? Yes, looking at the price action, it is clearly moving up and down before this low forms. Is the rejection strong? Yes, this is a clean, obvious low on the chart, a beautiful and clear rejection point. Are the volumes distributed well? Yes, there is a clear volume cluster here, with a lower volume zone sitting beneath it.
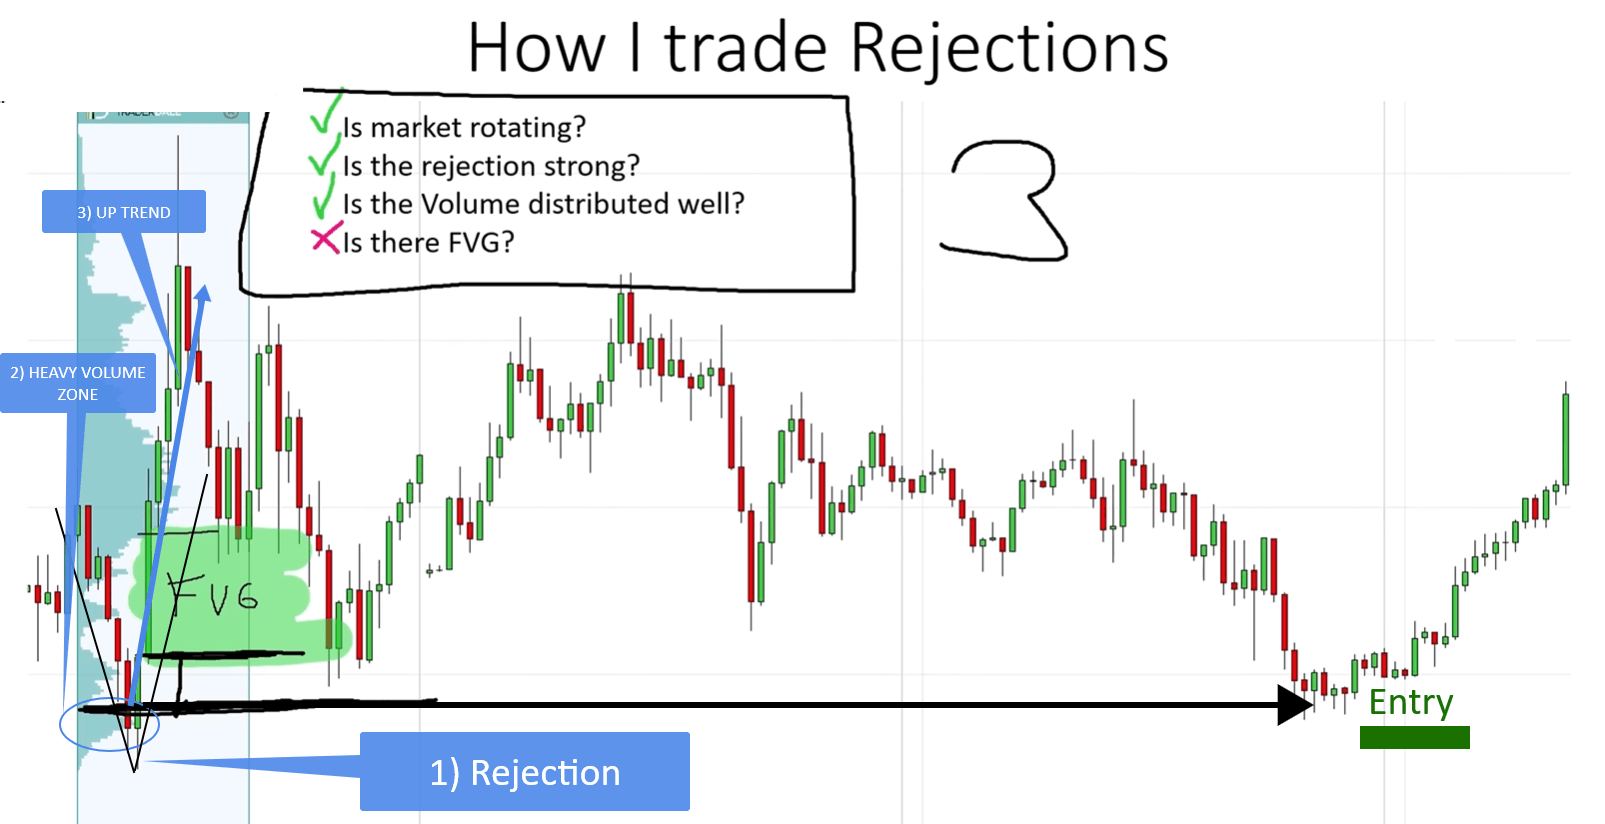
Now, is there a fair value gap? There is one, but it sits a little higher than ideal. In a perfect setup, the fair value gap would begin right at the top of the heavy volume cluster. Here it begins slightly above that point instead. This means only three out of the four checklist points line up perfectly. As covered earlier, three conditions out of four is still considered a strong setup, so this remains a good trade to take.
Entering the Long Trade
To enter this trade, mark the beginning of the heavy volume zone on your chart. From there, you can place a limit order at that level. Then simply wait. There is no need to chase the price or enter early. Let the price come back down to you.
Once the price pulls back and hits your limit order at the start of that heavy volume zone, you go long from there. This patient, rules based approach removes a lot of the guesswork and emotion from your trading. You already know your plan before the price even gets close to your entry. That makes it much easier to stay calm and stick to your strategy when the moment actually arrives.
How to Find the Right Entry Zone
This section ties everything together by focusing on the single most important detail in the entire process, which is finding the correct entry zone for your trade.
Why the Heavy Volume Zone Is the Real Resistance or Support
Many beginner traders assume that the exact tip of a high or low is the resistance or support level. This is a common mistake. The real resistance or support is the heavy volume zone that formed during the rejection, not the very top or bottom wick. Think of the heavy volume zone as the true battlefield where the biggest fight between buyers and sellers took place. That is the level future price action tends to respect, not the single highest or lowest point on the candle.
This is a core idea behind learning to trade Volume Profile rejections properly. It goes beyond just drawing a line at the obvious high or low like most beginners do. A single wick can be one random trade, or one moment of panic. A heavy volume zone, on the other hand, represents many trades happening together, over time, at roughly the same price. That is a far stronger signal of real interest from the market.
How the Fair Value Gap Confirms Your Entry
The fair value gap adds one more layer of confirmation to your entry zone. When the start of the fair value gap lines up closely with the start of the heavy volume zone, you have a stronger case for that level holding. These two clues, heavy volume and a fair value gap, often point to the exact same small area on the chart. When you see them overlap, treat that zone with extra respect. It usually represents a very clear shift in control between buyers and sellers. Learning to read this overlap is one of the most valuable skills you can build. It helps you trade Volume Profile rejections with real precision and confidence.
Final Thoughts
Learning to trade Volume Profile rejections comes down to one simple habit. Always run a possible setup through the four point checklist before you risk any money. Check whether the market was rotating. Check whether the rejection is strong and clean. Check whether the volume is distributed well, and whether a fair value gap supports the move. Remember that you do not need all four conditions every single time. Three out of four is still a solid, tradeable setup.
Once you confirm a good rejection, patiently wait for the price to pull back into the heavy volume zone. This is the real resistance or support, not just the tip of the candle. The two examples in this guide, one bearish and one bullish, show exactly how this process plays out on a real chart. With practice, running through this checklist will start to feel automatic every time you open your charts. Over time, it will help you avoid many of the weak, low quality setups that catch out less prepared traders. Small habits like this, repeated often enough, are usually what separates a consistent trader from one who is still guessing.
Start simple. Pick one chart today and run a recent rejection through all four points of the checklist. That small exercise is the fastest way to make this process feel natural the next time a real opportunity appears.
FAQ
1. Do all four checklist points need to be met to trade a Volume Profile rejection?
No. Three out of the four conditions are usually enough to consider the setup strong. All four lining up is ideal, but not required.
2. Where exactly should I enter my trade after spotting a rejection?
Wait for the price to pull back into the heavy volume zone formed during the rejection. This zone is the true resistance or support, not the very tip of the high or low.
3. What does a fair value gap actually tell me?
It shows that one side of the market, either buyers or sellers, moved with real aggression. When it lines up with the heavy volume zone, it adds extra confidence to your entry.
Next Steps
If this guide helped you understand how to trade Volume Profile rejections, there is more to learn. Watch the full video above to see both examples explained live on the chart. You can also explore the related articles on Volume profile to help build your skills. Or check out the full trading course and custom Volume Profile indicator to take your learning further.
Apply my coupon code KEVIN10 at checkout and receive a 10% discount on your purchase.
