
Hello guys,
today I am going to talk about my favorite combo of two trading setups. The first setup is based on Volume Profile and the other one on Price Action. What I want to see is these two setups align and both point to the same trading level.
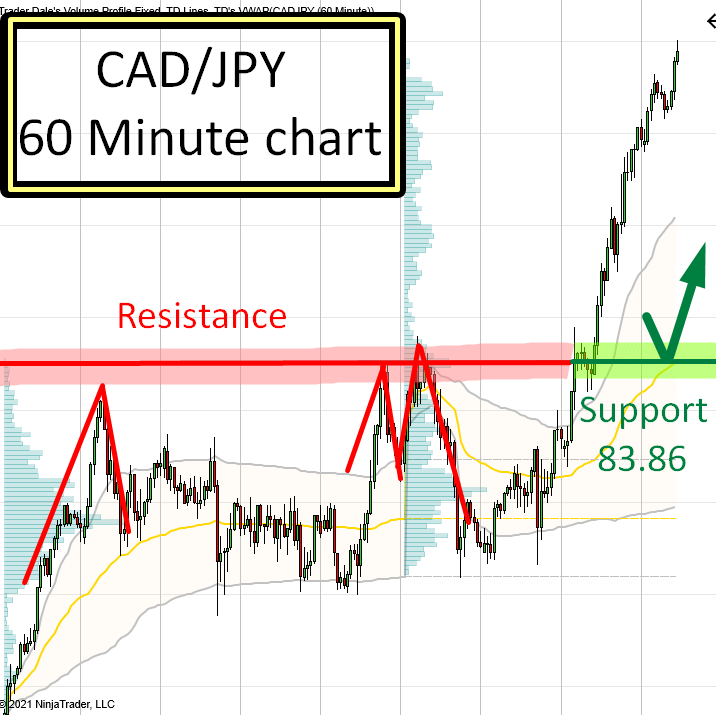
This is exactly what has occurred on CAD/JPY now.
Let me start with the Volume Profile setup first.
Volume Profile: Trend Setup
There is currently a strong uptrend on CAD/JPY. When there is a trend, then I want to know how the volumes were distributed within the trend.
For this, I use my Flexible Volume Profile indicator. In the picture below, you can see that I stretched it over the whole trend area.
What I look for are significant volume areas (I call them “Volume Clusters“). Those are bumps on the profile.
Those bumps represent places where heavy volumes got traded. When there is an uptrend, then I assume that those volumes are in important places for strong Buyers. Those Buyers were adding to their Long positions there as the price was going upwards.
This is a Volume Profile setup which i call the “Trend Setup“.
CAD/JPY; 30 Minute chart:
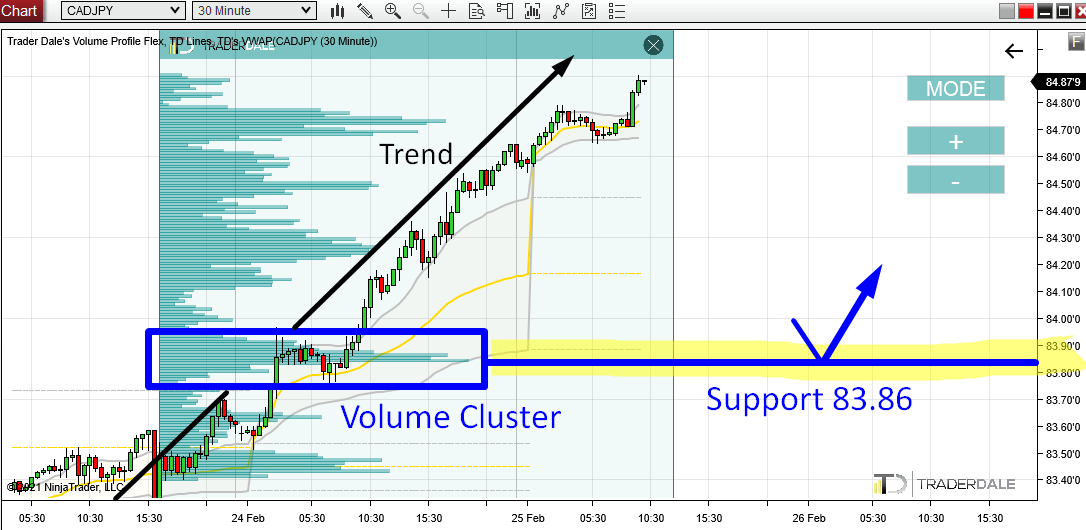
When the price makes it back (pullback) into those Volume Clusters, they should work as Supports. Those zones are important for Buyers and they will want to defend them.
In the picture above, there are more of those Volume Clusters. I chose only one of them to trade. Why?
Four reasons:
- It is the Volume Cluster with the heaviest volumes (Volume Profile is the thickest there).
- It is nice and “sharp” and you can easily see where the heaviest volumes got traded (83.86).
- Strong and aggressive buying activity started from there (those bullish candles above it).
- Confluence with Price Action setup. This is the most important reason and I am going to talk about it now:
PRICE ACTION: Resistance Turning Into Support
This is one of my most favorite Price Action setups.
It goes like this:
First, you want to see that there was a Resistance in the past (you can tell because the price was bouncing off this area). Then you want to see this Resistance breached.
When a Resistance gets breached and the price goes above it, then it becomes a Support.
If you want to learn more about this strategy, then go here:
PRICE ACTION: Resistance → Support
You can see this nicely on the picture below.
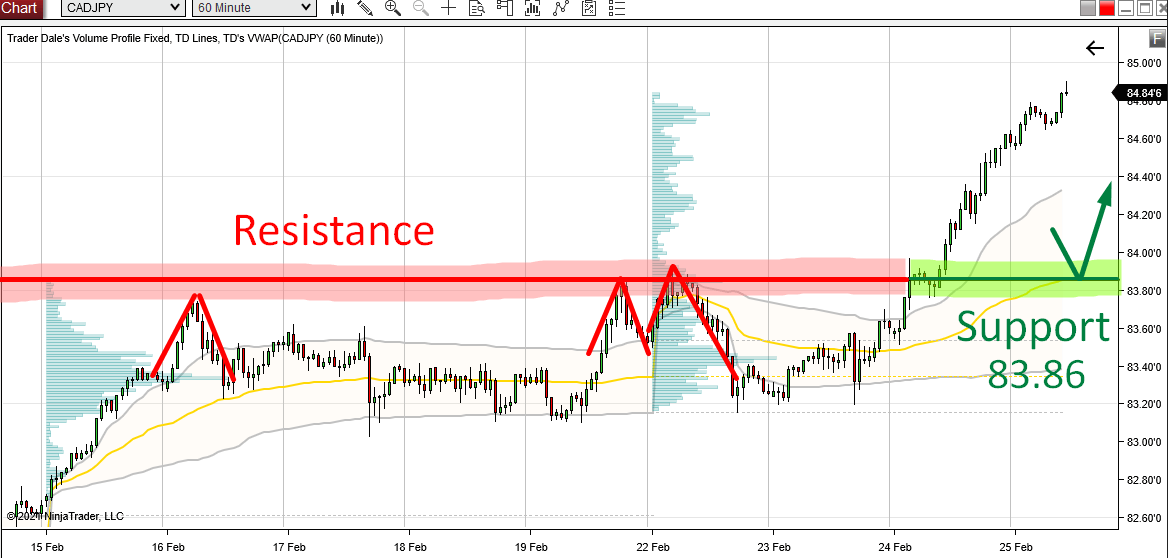
I rarely trade this setup just on its own, but I absolutely love to combine it with volume-based setups. Like the one I showed you (the “Trend Setup“).
The thing is, that in this case, both those setups point you to the same place. That’s what I want to see!
This is the main reason I picked the Volume Cluster around 83.86 over all the others.
I hope you guys liked today’s analysis. Let me know what you think in the comments below!
Happy trading
-Dale