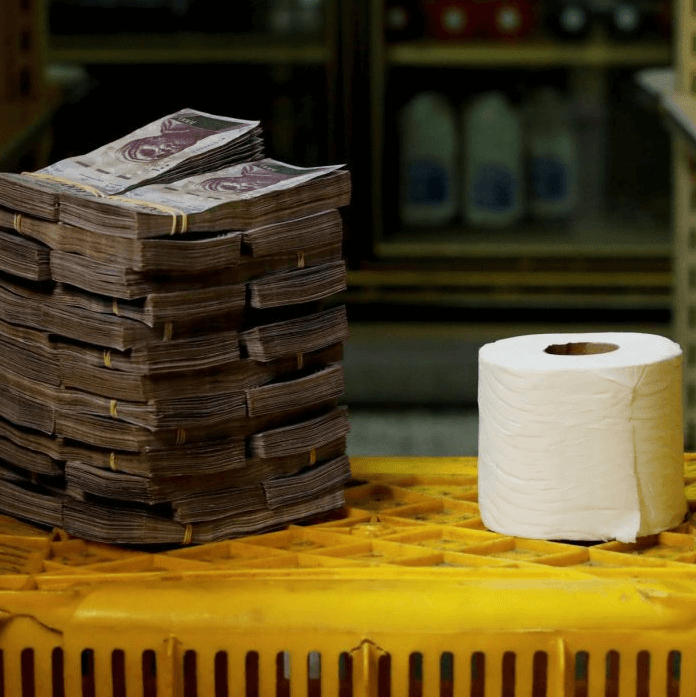
What is the difference between trading a currency pair (forex) and trading a commodity like Oil? It is quite simple: the Oil price cannot fall to zero, whereas a currency actually can devaluate so much it becomes almost worthless. A typical example is a hyperinflation in Venezuela. This picture shows how bad it was:
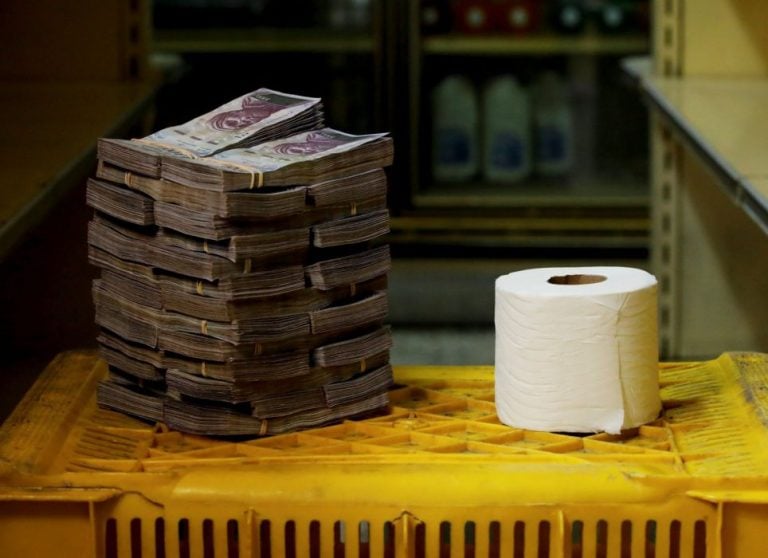
This sort of thing has already happened in many countries in the world, not just in Venezuela. The reason was that the central banks were printing too much money. This is extreme, but it can happen…
How deep can a commodity drop?
Can this happen with Oil or any other standard commodity? The answer is not black and white. It depends on how important the commodity is. I don’t think such devaluation can happen to Oil because it is an essential commodity which we need in almost every industry.
Can this happen to Gold? In my opinion much more likely! The reason is that gold does not have that much use. Only around 5-10% of it is actually used for something else than investment, coins and jewelry…
Why am I talking about this? Because I think there is now a good opportunity for an Oil investment. The reason is simple – it is cheap. Saudi Arabia and coronavirus crisis made this happen.
How deep can the Oil prices drop?
The price dropped from $60 to $20 just in three months. How deep can it fall? I don’t know but I know that it can’t go below zero 🙂 So, for me the strategy is simple – the lower it goes, the more I buy. I must warn you though. You need to have a big enough account to do this! But if you do, then it is a pretty viable strategy to follow on the Oil.
The trade entry is just a part of the story. We need a complete plan, right? We need to set a place where to quit the longs.
Take Profit for a Long trade
In my opinion, it is best to quit a trade just before it reaches a strong resistance. Why? Because a resistance could potentially endanger your trade and turn the price downwards again.
So, let’s look for a strong resistance on the Oil, shall we?
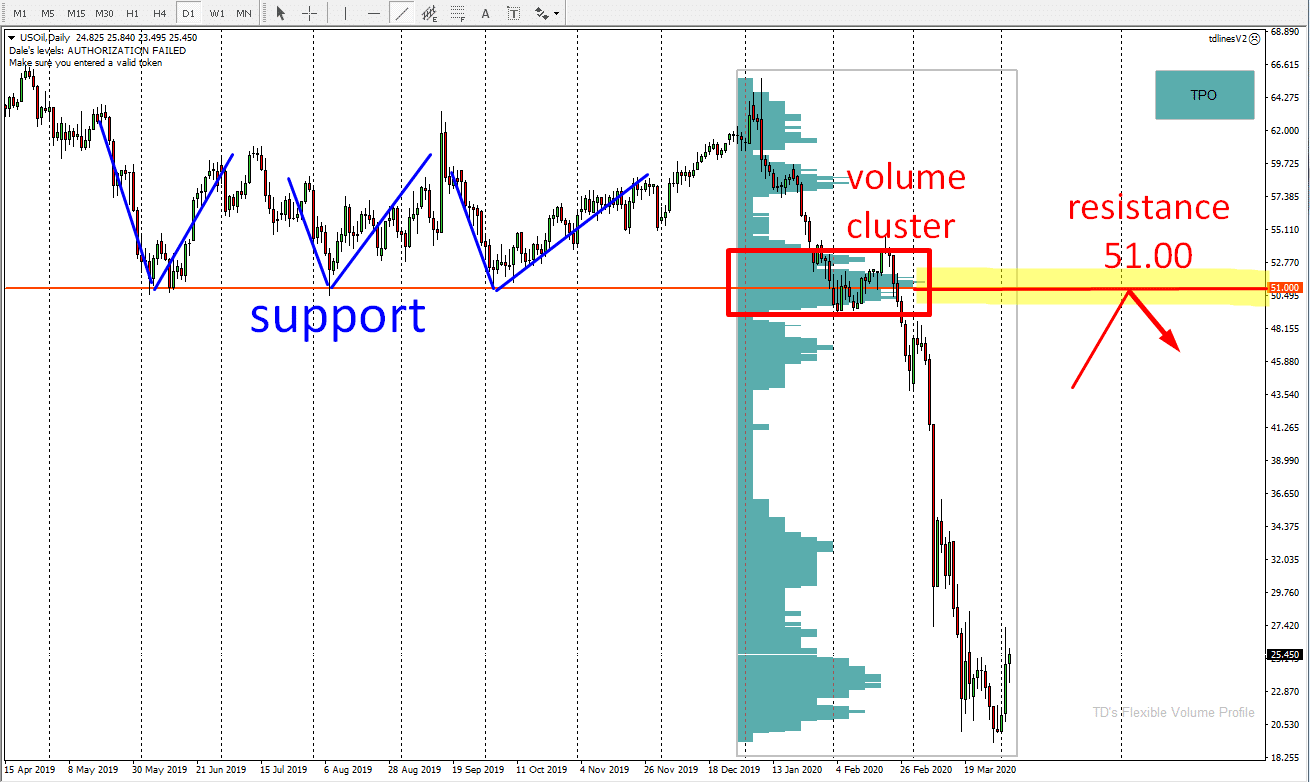
What I find ideal in such a long-term investment analysis is to use higher time frames. In this case I used the Daily chart.
I used my Flexible Volume Profile to look into the crazy trend area which started at the beginning of this year. The most important thing it showed was a significant volume cluster around 51.00. This is where I think a lot of the sellers added to their short positions.
When the price makes it back to this area it is pretty likely that those sellers will try to push the price down again because they will try to defend their short positions.
Support → Resistance setup
Apart from the volume cluster, there is also another confirmation of this resistance level. As you can see from the picture above, there were three really strong rejections of this level in the past. The price bounced off this level upwards and because of this I think it was a strong support.
When this support got breached in January 2020, it then became a resistance. It is a simple Price Action strategy and you can learn more about it here:
Price Action Strategy: Support Becoming Resistance
For those two reasons (volume cluster and S→R setup) I think the 51.00 is an ideal place to quit the long. Actually, the safest place would be little bit below 51.00 in case the price decided to turn a bit sooner (this happens sometimes). It may also not be a bad idea to immediately enter a short, but now it is probably too soon to think about this.
Do you want ME to help YOU with your trading?
Join one of my Volume Profile Educational courses and get my private trading levels, 15 hours of video content, my custom made Volume Profile indicators, and more!
Click Here
The cost of going Long
Trading such long-term positions can take up weeks or months. For this reason, it is important to know your costs for holding your trade overnight. You should be able to find the costs somewhere in your trading platform. What you should look for is a “symbol info”. It is a table that can look for example like this:
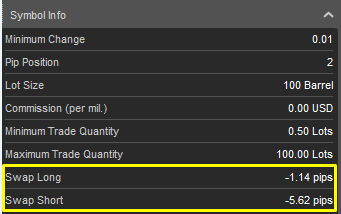
In this case, you want to know the Swap Long. It tells you how much it is going to cost you every day. Good news is that it costs five times less for a Long position than you would pay for a Short.
You have all it takes to trade this?
If you guys want to follow this strategy please consider if you have the guts for it and also if you have big account for it. Your account needs to withstand a big price drop and you should still be okay to hold the trade and even add to it! You need to be prepared for this!
Also, this is just my trading idea not any sort of recommendation. What you do with this idea is only up to you. You are trading with your money and it is you who is responsible for it.
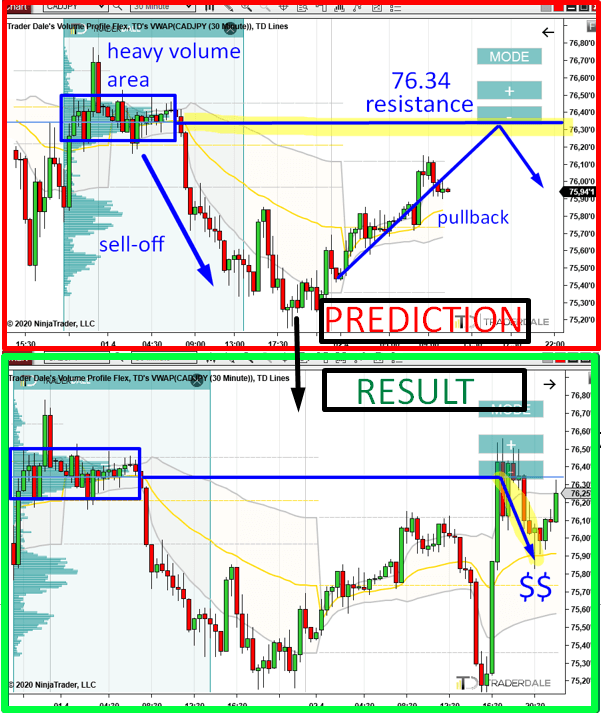
Yesterday’s trade on CAD/JPY
Did you read my CAD/JPY analysis yesterday? If no then you can read it here:
CAD/JPY: Volume Profile Analysis
Here is a picture from yesterday (PREDICTION) and below that it is the RESULT of the prediction.
I hope you liked today’s article guys. Let me know what you think in the comments below!
Stay safe and happy trading!
-Dale
Recommended Forex Broker
Having a solid broker with low spreads and commissions is ESSENTIAL for PROFITABLE TRADING!
Check out my recommended brokers
RECOMMENDED BROKER

haha, i laughed so hard on the title 😀 boy you were wrong