Today I would like to have a closer look with you at Oil. There are some pretty strong volume-based resistances and also one support. All these are nicely visible from higher time frames like 4 Hour or Daily.
If you look at the current price development, you can see that the Oil is currently in a downtrend.
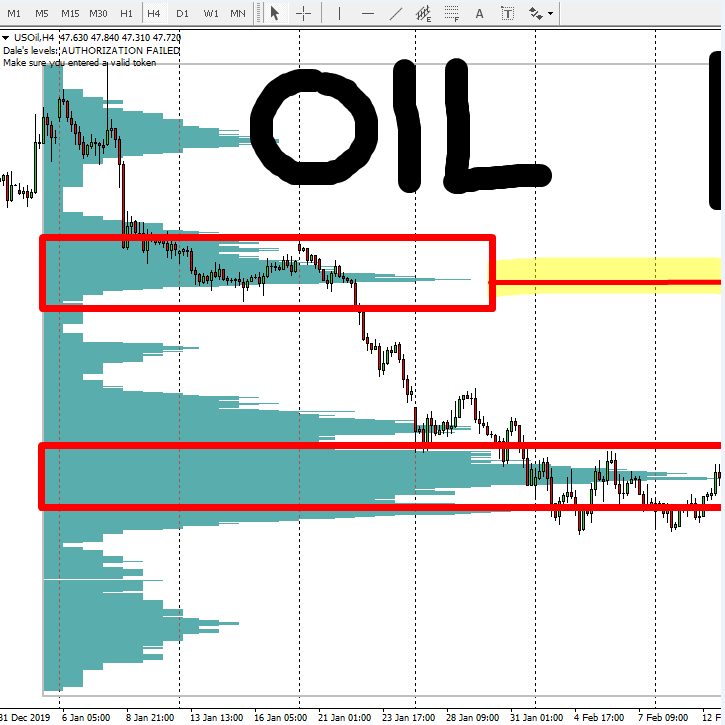
When there is a significant downtrend I always look for heavy volume clusters that got created within the downtrend.
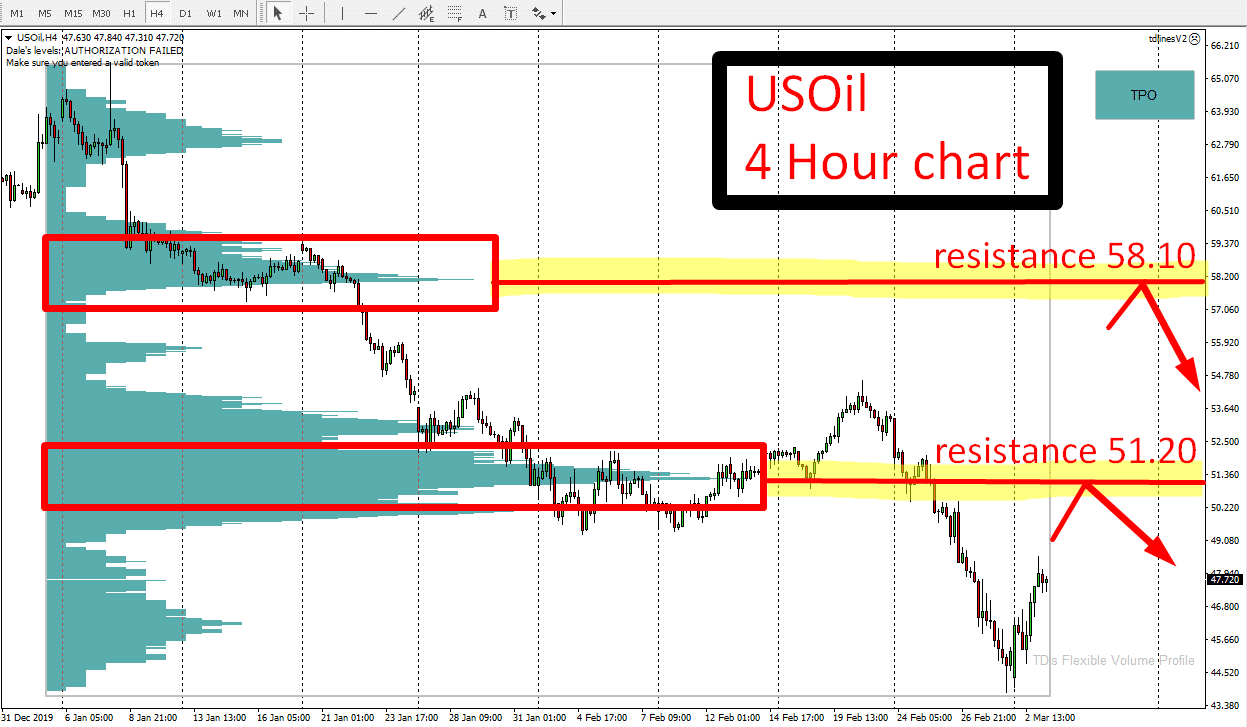
I used my Flexible Volume Profile indicator to look into the recent downtrend and I discovered that the most significant volume clusters were around 51.20 and 58.10. What do these Volume Clusters tell us?
They tell us that sellers who are currently pushing the price downwards were adding to their selling positions there (at these volume clusters).
How is that important now? This is important to know because when the price makes it back into these Volume Cluster areas again, those sellers will most likely become active again and they start aggressively pushing the price downwards again.
Do you want ME to help YOU with your trading?
Join one of my Volume Profile Educational courses and get my private trading levels, 15 hours of video content, my custom made Volume Profile indicators, and more!
Click Here
Support→Resistance
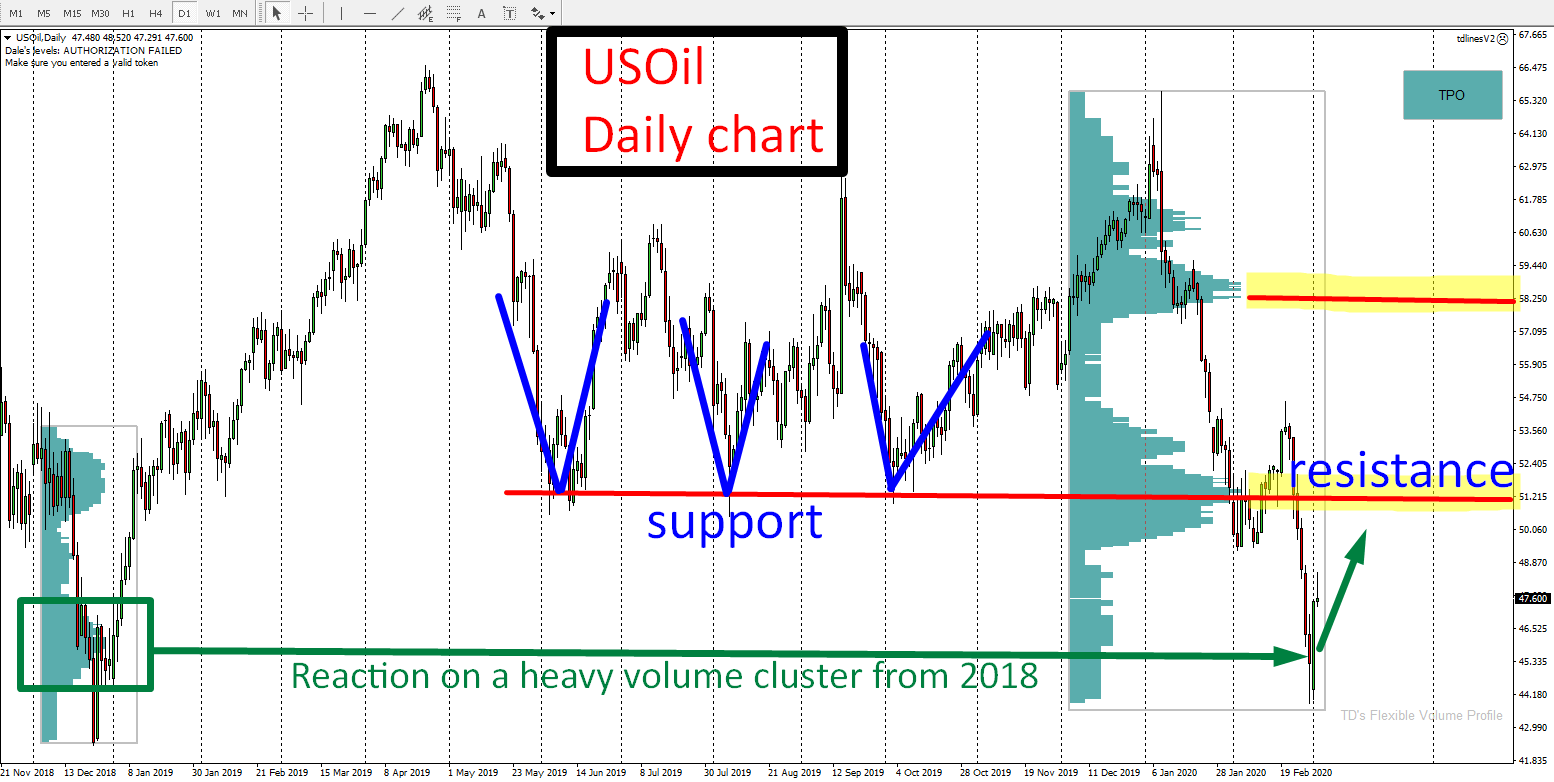
There is a nice confluence on the 51.20 resistance which I would like to point out. This confluence is best visible on higher time frame, for example on Daily chart.
If you look at the picture below you can see that the price bounced strongly off the 51.20 area. I marked it in blue. This tells me that this area was a strong support.
When a strong support gets breached it then becomes a resistance. This is what happened recently. The support got breached and now the price is way below it. This support (51.20) became a resistance.
As you can see all this happened at the volume-based level I found using Volume Profile. That’s what I call a nice confluence of trading signals!
Now we have volume-based resistance and at the same time this is also a breached support which became a resistance.
Heavy Volume Cluster from 2018
Another thing worth noticing on the Oil right now is how the price reacts to the heavy Volume Cluster which got formed in 2018.
I have already pointed this level out in the past in one of my Weekly Trading Ideas videos. Now the price finally hit this area and reacted to it. In my opinion, this buying reaction is not over yet and we may see some more aggressive buying activity that will help to push the price up – towards our volume-based resistance.
Recommended Forex Broker
Having a solid broker with low spreads and commissions is ESSENTIAL for PROFITABLE TRADING!
Check out my recommended brokers
RECOMMENDED BROKER
Current development of levels mentioned in previous articles
Here you can have a look at how the price reacted to some of the trading levels I published a few days ago in the Market Analysis articles.
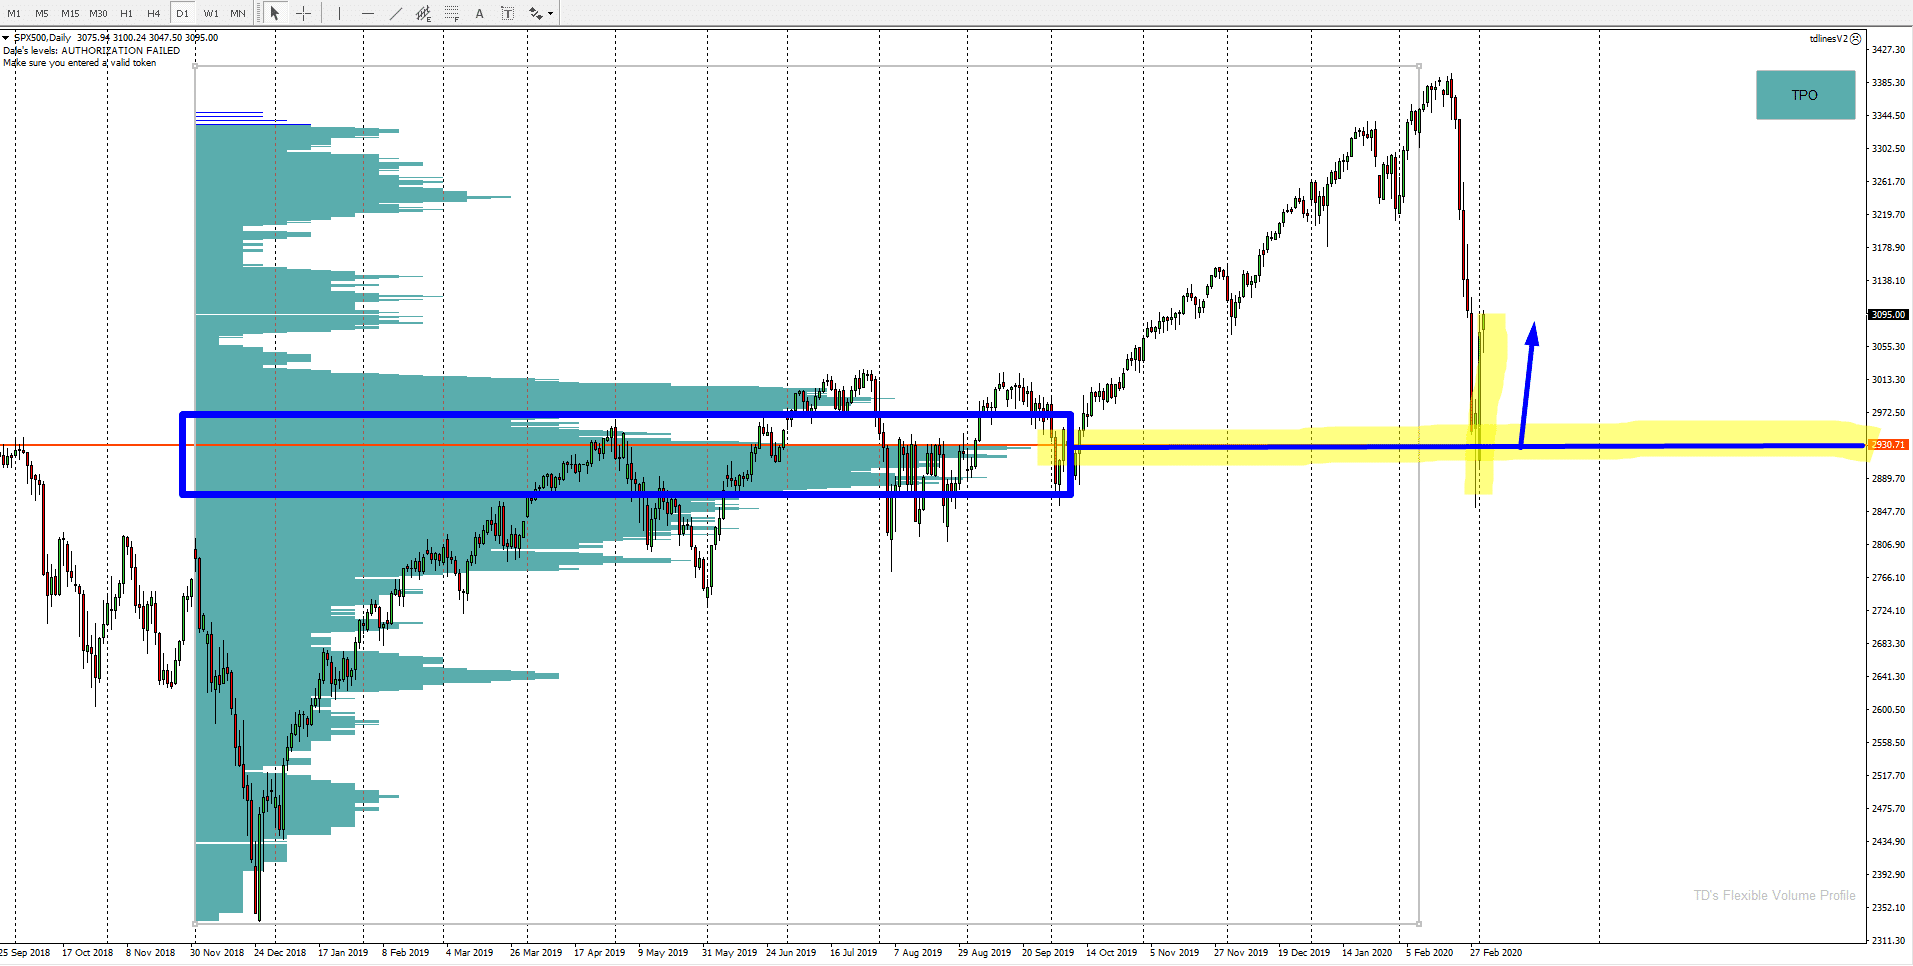
S&P 500 prediction
Here is S&P 500 support I talked about in this article:
Where Will The S&P 500 Sell-off Stop?
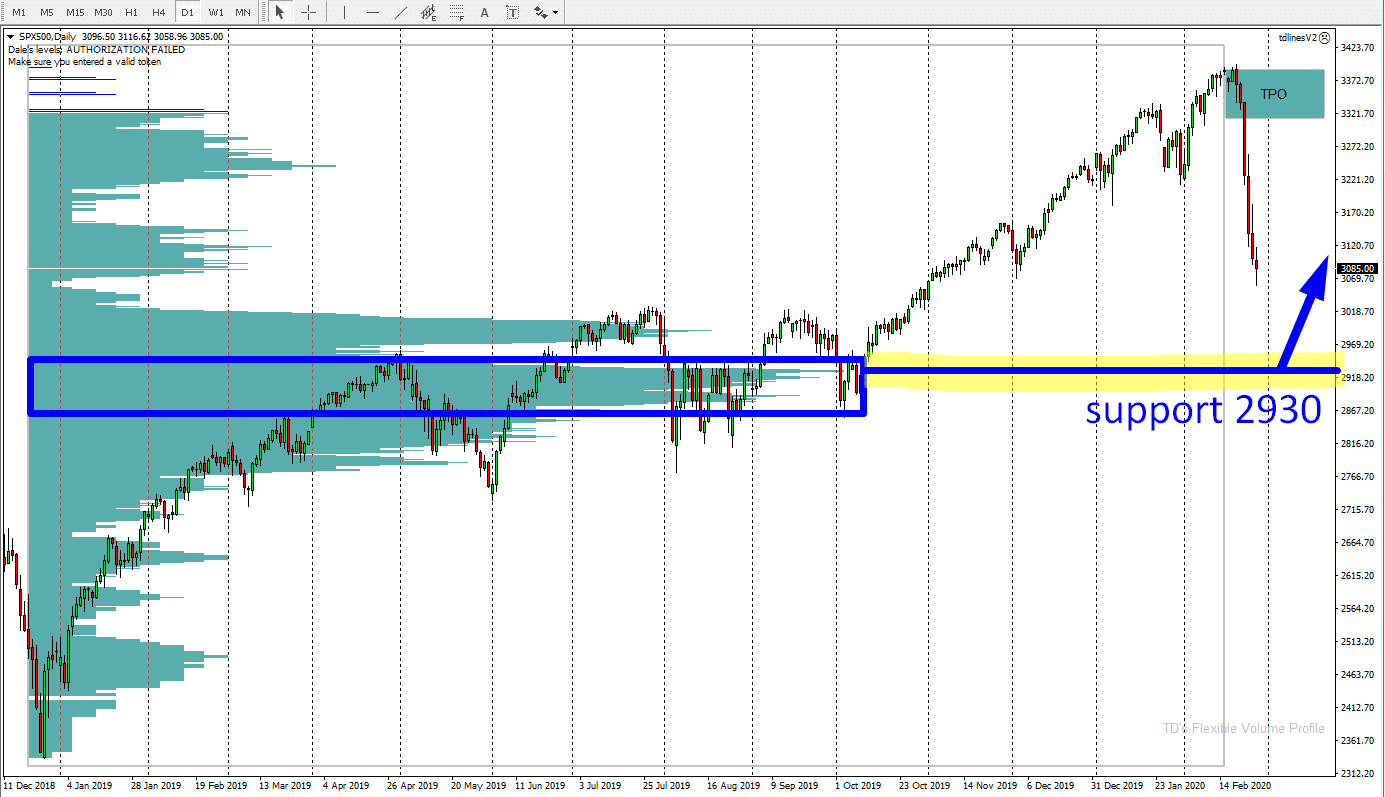
Here is the result:
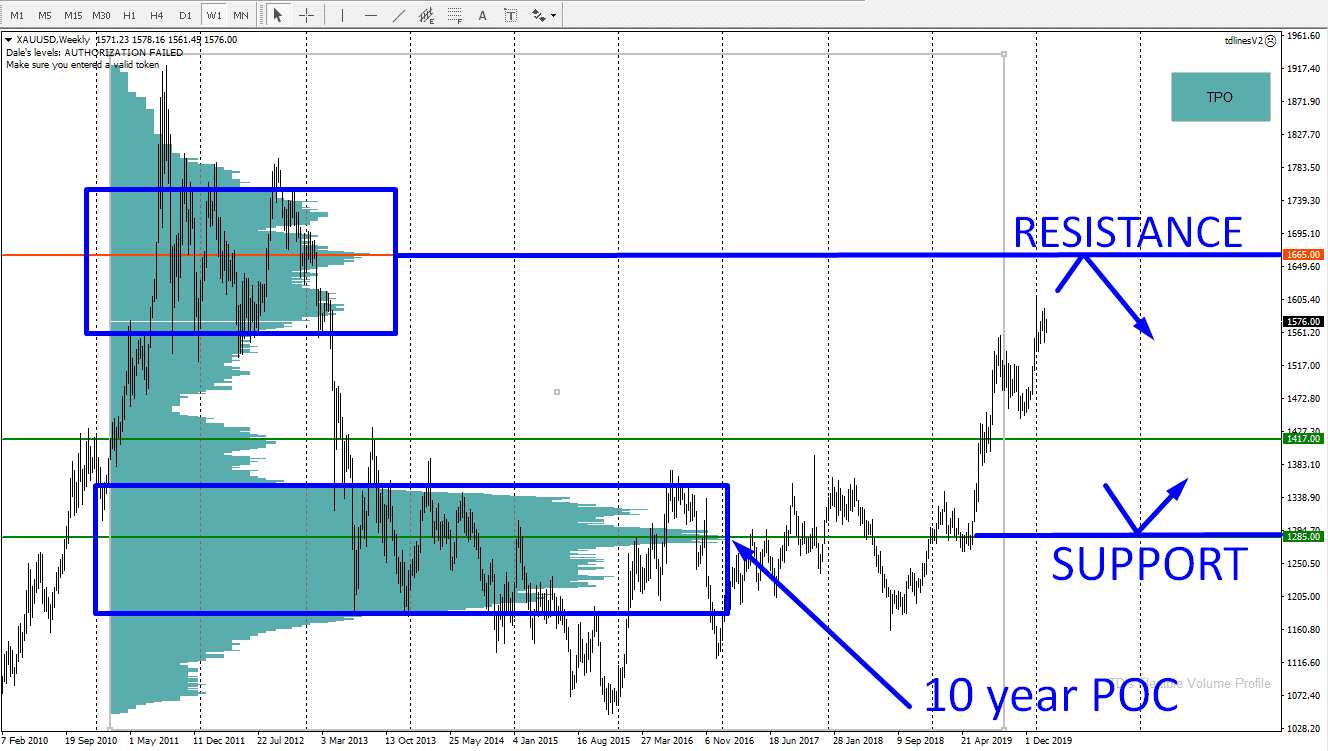
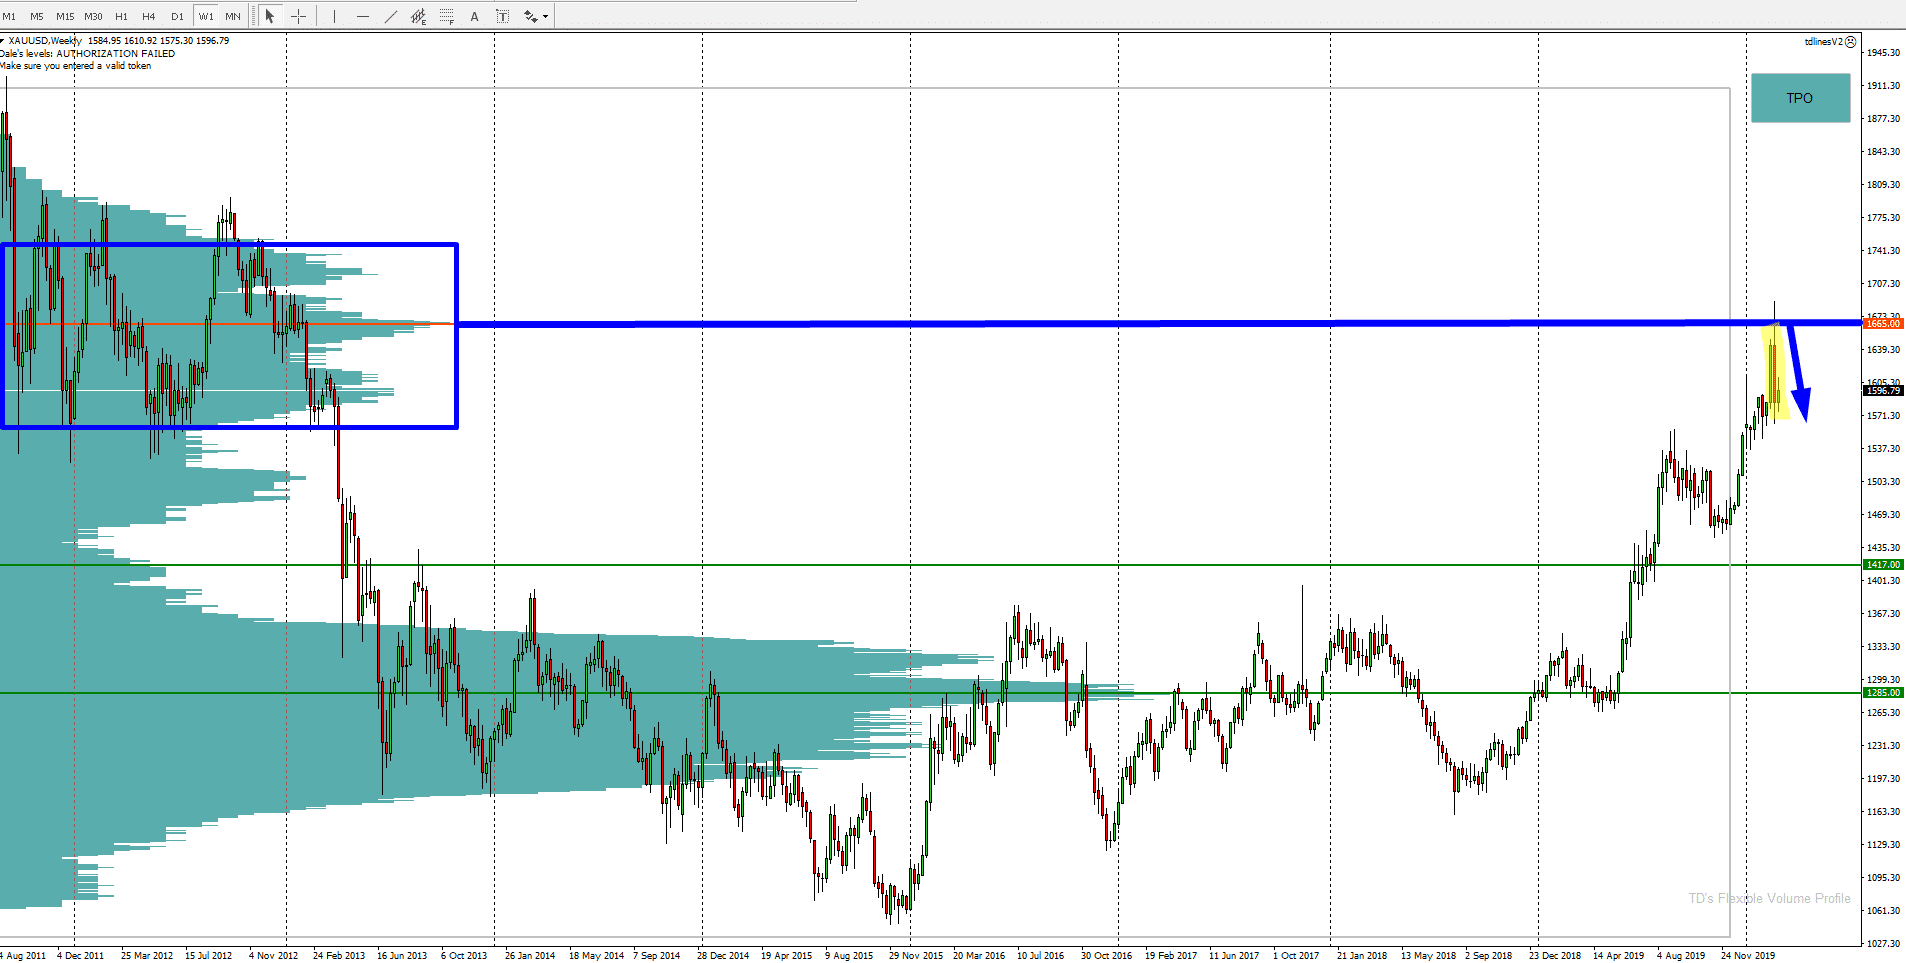
Gold prediction
Below is a reaction to a resistance on Gold I wrote about in this article:
Prediction:
Result:
I hope you guys like this article and my trading analysis. Let me know what you think in the comments below!
Happy trading!
-Dale