The EUR/USD is pushing upwards like crazy. It made over 400 pips just in eight days! An interesting thing is that there were eight consecutive bullish Daily candles (all green). Not a single pullback! This is a sign of strong and aggressive buyers. Even a blind person can see this.
How to trade in a trend
The main intraday trading strategy in such a situation is to wait for little pullbacks and enter long trades at supports.
In this article, I will focus mostly on those supports.
When there is an uptrend like now, it is best to use the Flexible Volume Profile to look into the volumes and how they were distributed throughout the uptrend.
What you are looking for are significant Volume Clusters. A Volume Cluster created within an uptrend tells you this: There were a lot of buyers adding to their buying positions there. Then they pushed the price even higher.
How does that help? When the price makes it back to a Volume Cluster then there is a solid chance that those buyers will become active again and that they will try and push the price upwards from this Volume Cluster.
Do you want ME to help YOU with your trading?
The current situation on the EUR/USD
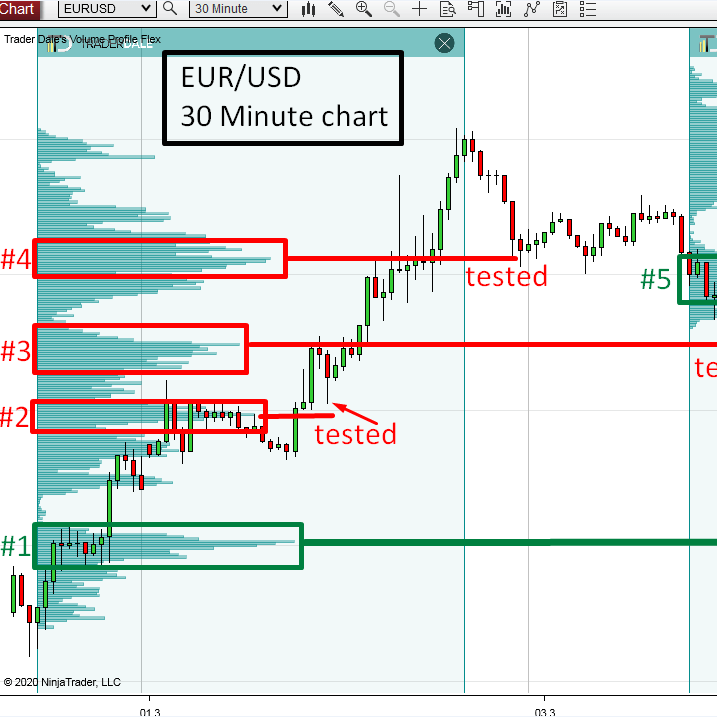
Let’s now have a look at the EUR/USD and examine all the Volume
Clusters one by one. Below, you can see a 30 Minute chart of the EUR/USD
with all significant Volume Clusters numbered #1 to #5.
#1 Volume Cluster
This one was created close to the beginning of the new strong buying activity. What i like about this one is that the volumes are distributed in a way that there is no doubt where the support is (Volume Cluster is nicely visible and “sharp” looking).
#2 Volume Cluster
This one is a bit weird one. There was a bit of sideways price action and then the price shot upwards. What happened an hour later was that there was a little pullback. This pullback went almost into the Volume Cluster zone.
Now it seems that those volumes have already been tested by this (support is no longer valid). Maybe it will still work but it would be the 2nd test and 2nd tests don’t have as good win rate as the 1st tests.
#3 Volume Cluster
I liked this one and I was looking forward to trading it. However, the price went quite close to it and then made a strong buying reaction. It seems that this support is also spent (tested).
My general rule is that a level is tested if price turns 3 pips or closer before reaching it. In this case, it was a bit more than 3 pips but given the higher volatility we see on EUR/USD now I rather discard this level because to me it just looks already tested.
#4 Volume Cluster
This one is already spent. The price made a nice pullback to it, and there was a 30 pip reaction. This support is no longer valid because the price has already reacted to it.
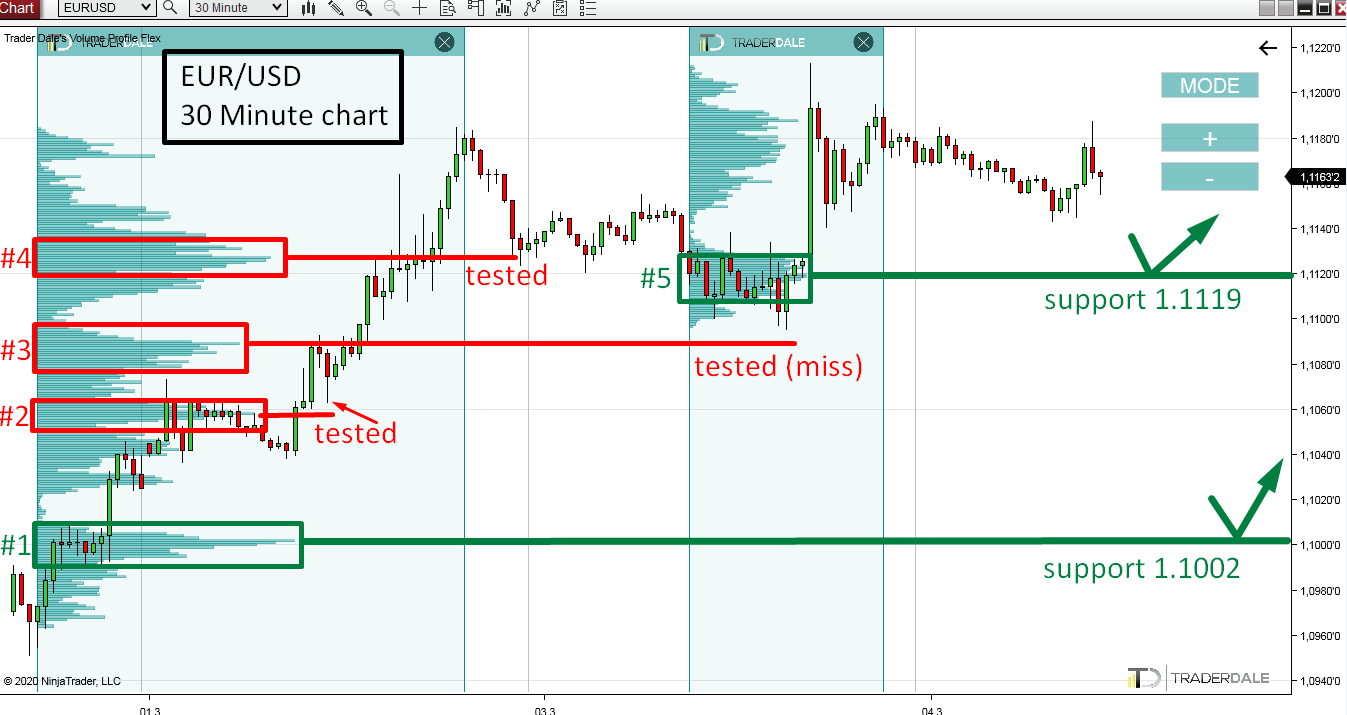
#5 Volume Cluster
The last Volume Cluster got created yesterday. What I like about it is that a really aggressive green candle shot from it. BTW that’s what I like to see in all volume-based support/resistance levels.
Now the price rotates above this support. This means that the market participants accepted the higher prices. This is important because if there was a sharp rejection of higher prices then it would mean higher prices weren’t accepted and that price won’t tend to return there.
But now, if there is a pullback into the 1.1119 support, then it is likely that the price will bounce from there and go upwards, back into the current rotation (current balance).
Recommended Forex Broker
I hope you guys liked this Volume Cluster analysis. Let me know what you think in the comments below!
Happy trading!
-Dale
Thanks for a great explanation, will be a member soon 🙂
I really like you stuff around VP
thank you! I am looking forward to having you in the course!
This kind of tutoring is very helpful, especially when you point out what goes wrong and why. Please keep these articles coming.
thanks John! I will do my best to keep those coming 🙂