
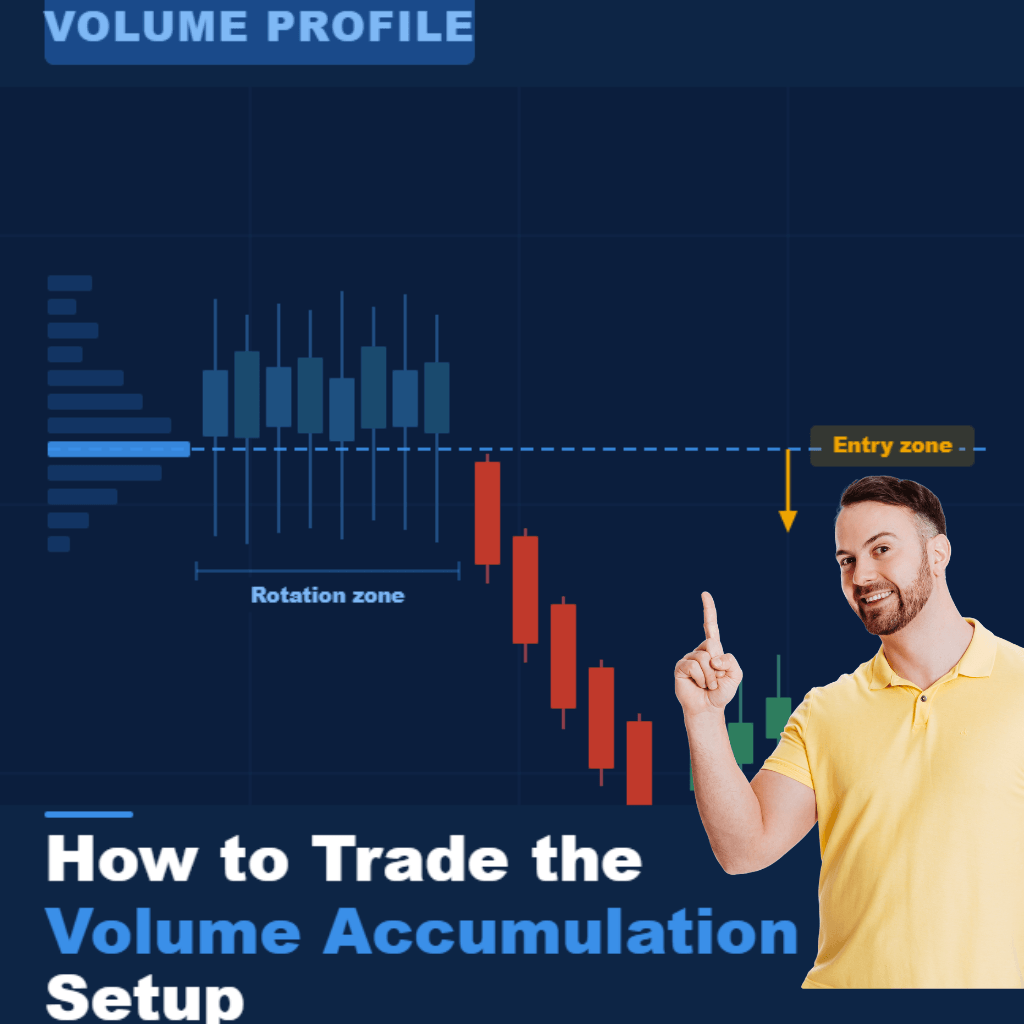
If you have ever watched the price return to the same level again and again and wondered why, this article has your answer. The Volume Accumulation Setup trading strategy is a Volume Profile method that reveals exactly where large institutions built their positions, and gives you a clear, repeatable way to trade those levels when price comes back to visit.
The strategy works because big market participants cannot place large orders all at once. They need time to load quietly, which is why they do it during sideways price rotations. Once they finish, they push the price in their direction. That rotation zone then becomes a magnet for future price action, and that is precisely where you place your trade.
In this article, you will learn how to identify valid rotation zones, apply the Volume Profile correctly, find the right entry level, and understand the two forces that drive price away from a heavy volume area every single time. Real trade examples across multiple markets are included to sharpen your pattern recognition. No prior Volume Profile experience is needed.
SUMMARY: 5 KEY POINTS
- The Volume Accumulation Setup identifies zones where institutions built large positions quietly.
- A valid setup requires a sideways rotation followed by a strong, decisive trend move.
- You enter trades at the first price pullback to the heaviest volume area — no confirmation needed.
- Two forces drive price away from the zone every time: defenders and opponents who quit early.
- The same logic applies across all markets and timeframes where Volume Profile can be used.
What Is the Volume Accumulation Setup?
Reading the market's footprints
The Volume Accumulation Setup is a trading strategy built entirely around the idea that markets leave footprints. Every time a large institution builds a position, whether buying or selling, that activity shows up as a concentration of volume at a specific price level. The setup teaches you how to read those footprints and trade in the same direction as the institution that left them.
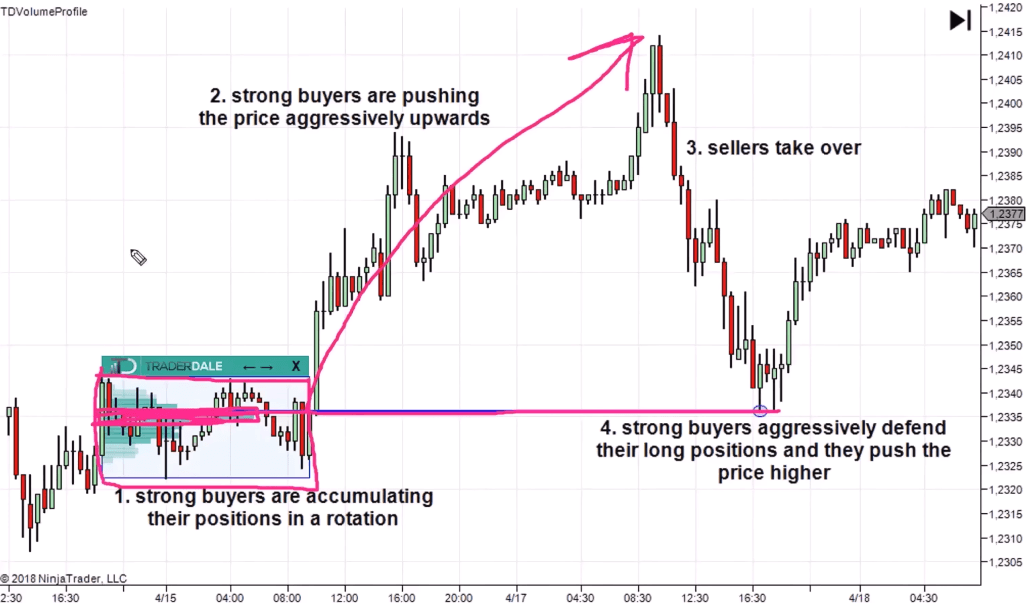
At its core, this strategy has two parts. First, you look for a period where price moves sideways, which is called a rotation. Second, you confirm that a strong trend followed that rotation. When both conditions exist together, you have a valid Volume Accumulation Setup. The rotation is the loading phase. The trend is the launch. Without both pieces present on the chart, the setup does not qualify and you simply move on.
What makes this setup particularly useful is that it removes guesswork from your trading decisions. You are not trying to predict where the market will go based on intuition. You are reading what already happened — where the heavy volume was placed — and using that as your anchor point for the trade. The history of the chart tells you everything you need to know.
How the Volume Profile makes it visible
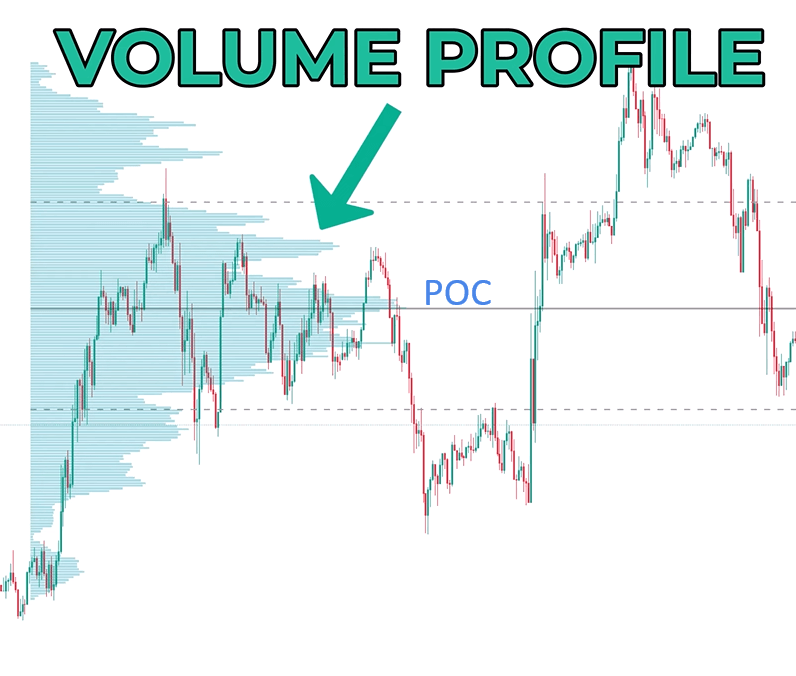
The Volume Profile is the tool that makes institutional accumulation visible. Unlike standard indicators that calculate based on price and time alone, the Volume Profile shows you volume distributed across price levels. It appears as a horizontal histogram running alongside your chart. The widest part of that histogram, called the Point of Control or POC, marks the price where the most volume was traded during the selected period.
Once you spot a rotation zone on your chart, you apply the Volume Profile specifically to that zone using the flexible or range setting. This isolates only the volumes traded during the rotation, keeping the data clean and relevant. The price level where the profile bar is at its thickest is where you draw your trade line. That level is your zone, and your future entry point.
This setup works across forex, indices, commodities, and crypto markets. It works on the 1-hour chart and on the daily chart. The logic is universal because the underlying behavior of large institutions never changes. They always need to accumulate before they can move the market at scale, and the Volume Profile always makes that accumulation visible to anyone who knows how to read it.
How Big Institutions Move the Market
The problem with placing large orders
To fully understand why the Volume Accumulation Setup works, you need to understand how institutional trading operates. Banks, hedge funds, and large trading desks work with enormous capital. A single institution might need to buy or sell millions of units of a currency pair, or thousands of contracts in a futures market. That kind of order cannot be executed in one go without causing a visible price impact.
If a large institution placed a massive buy order in an already trending market, the price would jump immediately. Other participants would notice the spike in order flow, and the institution would end up with a poor average entry price as everyone else reacts. To avoid this, institutions distribute their orders slowly and quietly during periods of low directional movement. This is exactly what a sideways rotation looks like on your chart. The price appears calm, but underneath, a large player is loading up.
Why the trend following the rotation is the confirmation signal
During a rotation, price bounces within a contained range and buyers and sellers appear evenly matched. To most observers, nothing significant seems to be happening. The Volume Profile, however, tells a different story. Heavy volume concentrated in a tight price band during a rotation is a clear sign that a large market participant has been building a position with intention.
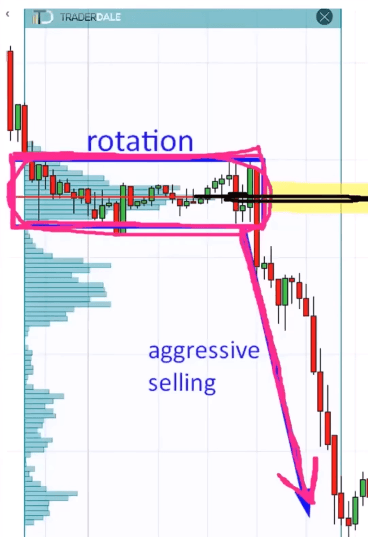
Once the institution finishes accumulating, it has both the position size and the capital to push the market. The price breaks aggressively in the direction of its orders. Buyers push it up. Sellers push it down. This fast, decisive trend phase immediately following the rotation is the confirmation you need. Without a clear trend break after the sideways period, there is no evidence of institutional intent, and the setup is not valid.
Phase | What it looks like on your chart | What is really happening |
Rotation | Sideways price movement, no clear direction | Institutions quietly loading positions |
Trend break | Sharp directional move away from the range | Institution finishes loading and pushes price |
Pullback | Price returns toward the rotation zone | Your entry opportunity presents itself |
Continuation | Price moves away in the trend direction | Institution defends its accumulated position |
This four-phase structure repeats across timeframes and instruments because the underlying logic never changes. Large participants always need to accumulate before they can move the market at scale. The Volume Profile makes that accumulation visible to traders who know what to look for.
Step-by-Step: How to Trade the Volume Accumulation Setup
The four steps from chart to entry
Now that you understand the logic, here is exactly how to trade this setup from start to finish. The process is simple, repeatable, and applies to any market or timeframe. Once you have practiced these four steps a handful of times, they become second nature on your live chart.
- Find a rotation followed by a strong trend: Scan your chart for a period where price moved sideways for a meaningful stretch of time. Then confirm that a sharp, decisive trend followed immediately after. This combination is your first filter. If there is no clear trend break after the rotation, the setup is not valid and you move on to the next chart.
- Apply the flexible Volume Profile to the rotation zone only: Use the range or flexible Volume Profile tool and drag it across the entire rotation area, from where the sideways movement began to the point where the trend started. You want to see how volume was distributed specifically during that phase, not across the whole chart history.
- Identify the thickest part of the profile and draw a line: Look for the price level where the Volume Profile bar is at its widest. That is where the heaviest volume and the greatest concentration of institutional activity occurred. Draw a horizontal line at that exact price level. This line becomes your trade zone and your future entry point.
- Wait for a pullback and enter at first touch: Set a price alert or a limit order at your drawn line. When price eventually returns to that level, enter in the direction of the original trend. If the trend was downward, go short. If it was upward, go long. No additional confirmation is required. Enter at first touch.
Setting your stop loss and take profit
For your stop loss, place it just beyond the outer edge of the rotation zone. If price breaks past the entire accumulation area, the original thesis is no longer valid and you want to exit quickly to limit your loss. A stop positioned just outside the zone is tight enough to protect capital while staying wide enough to avoid being clipped by normal noise within the zone itself.
There is no time limit on this setup. Markets have strong memory. A volume zone formed weeks or months ago can still produce a powerful reaction when price returns to it. Draw the line, set an alert, and simply wait.
For take profit, look to the previous swing high or low in the direction of your trade. Alternatively, use a fixed risk-to-reward ratio of at least 1:2. Because you are entering at a precise and well-defined zone, your stop can often be kept tight, which makes achieving a 1:2 or even 1:3 risk-to-reward ratio entirely realistic on most setups that follow through cleanly.
Why This Setup Works: The Two Driving Forces
There are always two forces at work
Understanding why the Volume Accumulation Setup works is just as important as knowing how to execute it. When you understand the mechanics, you stop second-guessing entries and hold your trades with far greater confidence. Every time price returns to a heavy volume zone, two separate forces push it away from that level simultaneously.
Force | Who they are | What they do |
Force 1: Defenders | Institutions that built positions in the accumulation zone | Defend the zone with new orders to protect their positions from going into loss, pushing price back in the trend direction |
Force 2: Opponents | Traders who entered against the trend | Close losing positions at the zone to cut their losses — each closure places a buy order that adds momentum to the reaction |
Why both forces always activate at the same level
They operate simultaneously every time price revisits a heavy volume area. The defenders are placing orders because they need to protect their positions. The opponents are also placing orders because they are exiting trades they no longer want to hold. Both groups act at the same price level, and both groups are motivated by the same zone. The result is a sharp, concentrated reaction that makes these levels among the most reliable turning points in any market.
You cannot always determine which force is stronger at any given moment. Sometimes the defenders generate most of the movement. Sometimes, it is the opponents cutting their losses who drive the price harder. The outcome, price bouncing firmly away from the zone, is the same regardless of which group dominates. What matters is recognizing that both forces will show up, not identifying exactly who is responsible.
This dynamic also explains why the entry at first touch is so effective. The moment price reaches the zone, both forces activate at once. Defenders see their risk increasing and immediately begin acting. Opponents see the significant level approaching and start closing positions before they take a bigger hit. The reaction is often immediate and sharp, which is why waiting for a candle to close or for a secondary confirmation typically means the best portion of the move has already passed. The zone itself is the signal.
This same logic applies beyond the Volume Accumulation Setup. Every significant volume concentration on any chart creates the identical two-force dynamic when price returns to it. Heavy volume areas consistently act as strong support or resistance because real market participants with real financial motivation are behind every reaction. Their motivations at those levels are always the same, which is exactly what makes them so reliable across time, instrument, and timeframe.
Real Trade Examples Across Different Markets
Why examples build pattern recognition faster than theory
The Volume Accumulation Setup is not limited to one specific market or currency pair. The following examples show how the same logic plays out across different instruments, each with its own characteristics but sharing the identical structural pattern. Studying multiple examples is the fastest way to develop the visual pattern recognition needed to spot a valid setup quickly when it appears on your live chart.
Example 1: A short trade setup
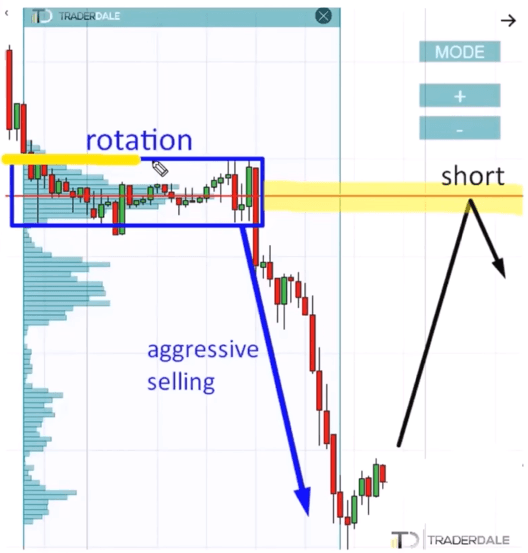
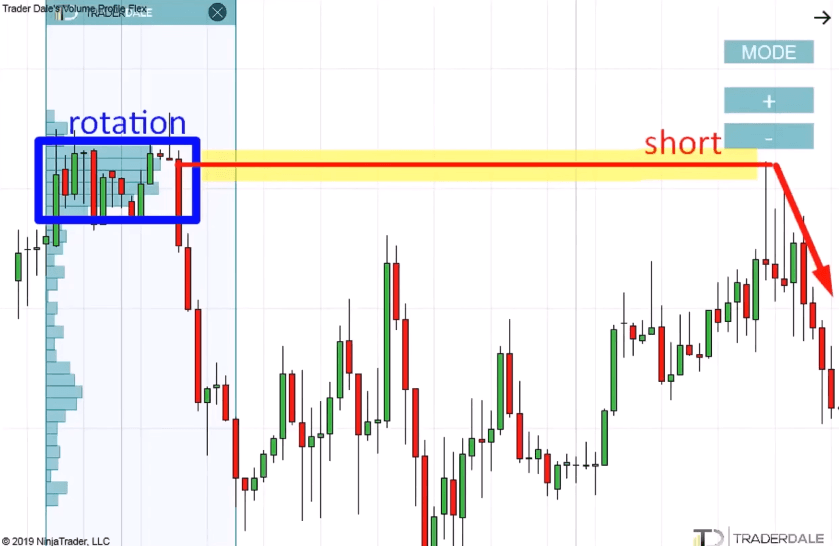
In the first example, price forms a clearly visible rotation zone over a number of sessions. During this time, the Volume Profile applied to the range reveals a very thick horizontal bar at one specific price level, which is a clear sign that a significant amount of trading activity was concentrated there. Following the rotation, a sharp and aggressive downtrend develops. This confirms that institutions were building short positions during the sideways phase and then pushed the price downward once they finished loading.
The trade plan is straightforward. You draw a horizontal line at the thickest part of the Volume Profile, set a price alert, and wait. When price eventually rallies back to that level, days or even weeks later, you enter a short position at first touch. The stop goes just above the upper edge of the rotation zone. Price then resumes its downward move, delivering the expected continuation in the direction of the original trend.
Example 2: AUD/JPY long trade
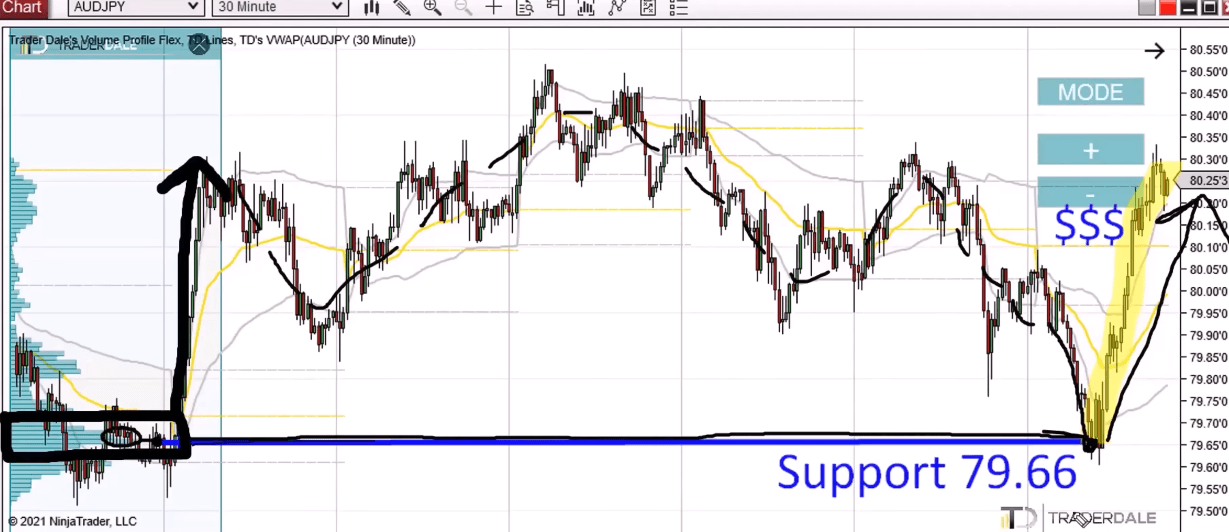
On AUD/JPY, a rotation forms with an unusually thick volume concentration at one particular level. The Volume Profile is noticeably wider there than at any surrounding area, which signals particularly strong institutional interest at that price. After the rotation, price moves sharply upward as strong buying activity carries the market higher over a sustained period. This tells you that the heavy volume zone below is a defended long position that was built by institutional buyers during the rotation.
When price eventually pulls back down toward that level, this is your long entry. The buyers who accumulated there do not want the market to trade below their entry zone, as that would mean their positions are moving into a loss. You go long at first touch of the zone, place your stop just below the lower edge of the rotation, and target the previous swing high. AUD/JPY demonstrates clearly how this setup works just as well on cross pairs as it does on major currency pairs.
Example 3: EUR/GBP long trade
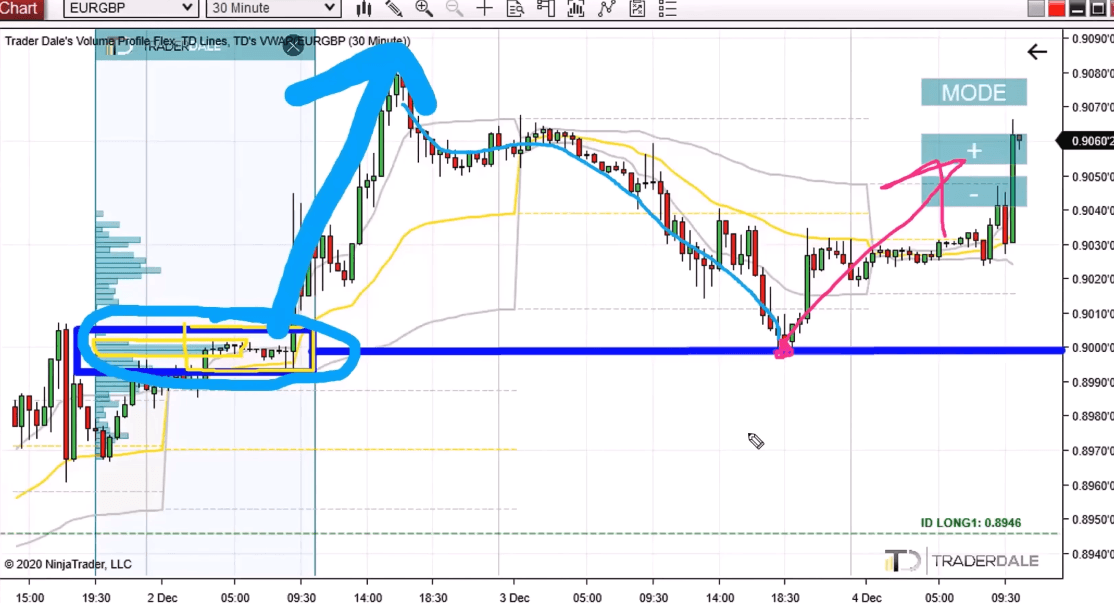
The EUR/GBP example features a tighter, more compressed rotation zone compared to the previous two. Despite the rotation being smaller in terms of price range, the Volume Profile still shows a clear and distinct concentration of volume at one level. This teaches an important lesson: the physical size of the rotation zone is not what determines its validity. What matters is whether there is a meaningful and visible volume concentration within it. A small range with concentrated volume can produce just as powerful a reaction as a wide one.
After the tight rotation, strong buying activity pushes price higher. When price later returns to the heavy volume level on a pullback, the long entry is taken at first touch. The setup plays out in exactly the same way as the previous examples, demonstrating the repeatability of this approach regardless of the instrument or the physical size of the rotation zone that generated it.
Market | Setup type | Rotation style | Trade direction | Key observation |
Example 1 | Short | Wide rotation | Sell on pullback | Sharp sell-off confirmed institutional short buildup |
AUD/JPY | Long | Wide, massive volume | Buy on pullback | Exceptionally thick profile signaled strong buyer interest |
EUR/GBP | Long | Tight rotation | Buy on pullback | Small range but volume was still clearly concentrated at one level |
Common Mistakes Traders Make with This Setup
Applying the Volume Profile to the wrong area
One of the most frequent errors is using a fixed-session Volume Profile instead of a flexible range profile applied specifically to the rotation zone. If you apply the Volume Profile across the entire chart history, or across a period that includes both the rotation and the trend, the data becomes diluted. The thickest level on that broader profile may not represent the institutional accumulation zone at all and could reflect a completely different period of activity.
Always use the flexible or range tool and isolate exactly the rotation area, from where the sideways movement began to the point where the directional trend started. That is the only zone that contains the relevant institutional accumulation, and the only zone that will produce the reaction you are anticipating on the pullback.
Entering too late after multiple touches
The setup is designed for entry at first touch. The moment price revisits the zone for the first time after the trend, both driving forces are at their strongest. With each subsequent touch of the same zone, some of those participants have already been shaken out, adjusted their positions, or moved their stops. The zone gradually loses the concentrated pressure that made it powerful in the first place.
By the third or fourth touch, the reaction may be weak, slow, or entirely absent. If you miss the first touch, it is better to wait for a completely new setup on a fresh chart than to force an entry at a zone that has already been partially used up. Patience is not just a virtue in this strategy. It is a core part of the method itself.
Ignoring high-impact news events
Volume zones are technically strong, but they are not immune to major fundamental catalysts. A central bank rate decision, a surprise employment report, or an unexpected geopolitical development can override even the most clearly defined institutional zone. Before entering a trade at a Volume Profile level, check the economic calendar. If a high-impact news event is scheduled within the next hour or two, wait for it to pass before entering. Volume zones work best in a technically driven environment, not during moments when news is actively reshaping market expectations across the board.
Mistaking low-volume consolidations for valid rotations
Not every sideways period qualifies as a valid rotation for this setup. If price consolidates for only two or three candles with minimal volume, there simply was not enough time or activity for institutions to accumulate in any meaningful way. A valid rotation has a Volume Profile that is noticeably wider at the key level compared to the bars surrounding it. That visible width is the evidence of genuine institutional interest.
A thin, low-volume consolidation will not produce the two-force reaction when price returns to it. The defenders are not present in meaningful size, and the opponents who need to exit are too few to generate any real push. Learn to distinguish genuine institutional accumulation zones from ordinary low-volatility consolidations. The width of the Volume Profile bar tells you the difference clearly and without ambiguity.
Conclusion
The Volume Accumulation Setup is one of the most structurally sound approaches in volume-based trading. It works because it is grounded in observable, repeatable behavior — the behavior of large institutions that must accumulate positions before they can move the market, and that always leave behind a trail of concentrated volume as evidence of that accumulation.
By learning to identify those zones and trade back to them on pullbacks, you align your entries with the most powerful forces operating in the market at any given time. The setup asks nothing complicated of you. You need a rotation, a trend, a Volume Profile applied to the right area, and the discipline to wait for price to return. When it does, you enter at first touch and let the two-force reaction do its work.
What makes this setup genuinely durable is that it does not expire. A zone formed months ago can still produce a clean reaction today, because the institutions that built those positions continue to hold them and remain motivated to defend them. The market has a long memory, and Volume Profile gives you the tools to read it accurately. Apply the four steps consistently, stay away from the common mistakes outlined in this article, and you will find that the Volume Accumulation Setup becomes one of the most dependable patterns in your regular trading routine.
Frequently Asked Questions
Do I need a special platform or indicator to use this setup?
You need a charting platform that supports a flexible or range-based Volume Profile tool — one that lets you manually select a custom time range and apply the profile only to that area. This is available on platforms like TradingView, Sierra Chart, and NinjaTrader. The standard fixed-session Volume Profile is not sufficient for this setup because it does not allow you to isolate the rotation zone specifically.
How do I know if the rotation had enough institutional volume to be valid?s like the 15-minute chart?
Compare the width of the Volume Profile bar at the key level to the width of the surrounding bars within the same rotation. If one bar is noticeably thicker than the rest, that is the confirmation of meaningful accumulation at that price. If all bars across the rotation look roughly the same width, the volume was distributed too evenly and the zone is unlikely to produce a strong reaction on the pullback.
Can this setup be applied on shorter timeframes like the 15-minute chart?
The logic applies across all timeframes, but institutional volume tends to produce cleaner and more reliable zones on higher timeframes such as the 1-hour, 4-hour, and daily charts. On very short timeframes, noise and random volume spikes can make it harder to distinguish genuine accumulation from ordinary market activity. Starting on the 1-hour chart is a practical and sensible approach for most traders learning this method for the first time.
Next Steps:
Want to go deeper with Volume Profile trading? Explore custom Volume Profile indicators and structured trading education to build on what you have learned in this article.Visit: https://trader-dale.com
