In today’s video, our Head Trader David breaks down a draw on liquidity trade from Monday, May 18th, 2026.
This is a very powerful setup because price had already shown clear intent, built liquidity above the target, manipulated traders into the wrong side, and then distributed lower into the Asia low.
In the 🎞️ video, you will learn:
✅ What a draw on liquidity trade is
✅ Why clean trendline liquidity can be engineered liquidity
✅ How accumulation, manipulation, and distribution formed the setup
✅ How SMT divergence between NQ and ES added extra confluence
✅ Why the inverse fair value gap became the entry model
👉 Watch the full breakdown here:
www.trader-dale.com/draw-on-liquidity-trading-strategy-20th-may-26/
PS: If you are serious about pursuing professional trading, I encourage you to explore our 🎓Funded Trader Academy. This program offers the unique opportunity to trade directly alongside our team on a daily basis, receive personalised one-on-one mentorship, and follow a well-established path to becoming a funded prop firm trader.
Click the link below to learn more:
trader-dale.com/funded-trader-academy/
... See MoreSee Less
2 days ago
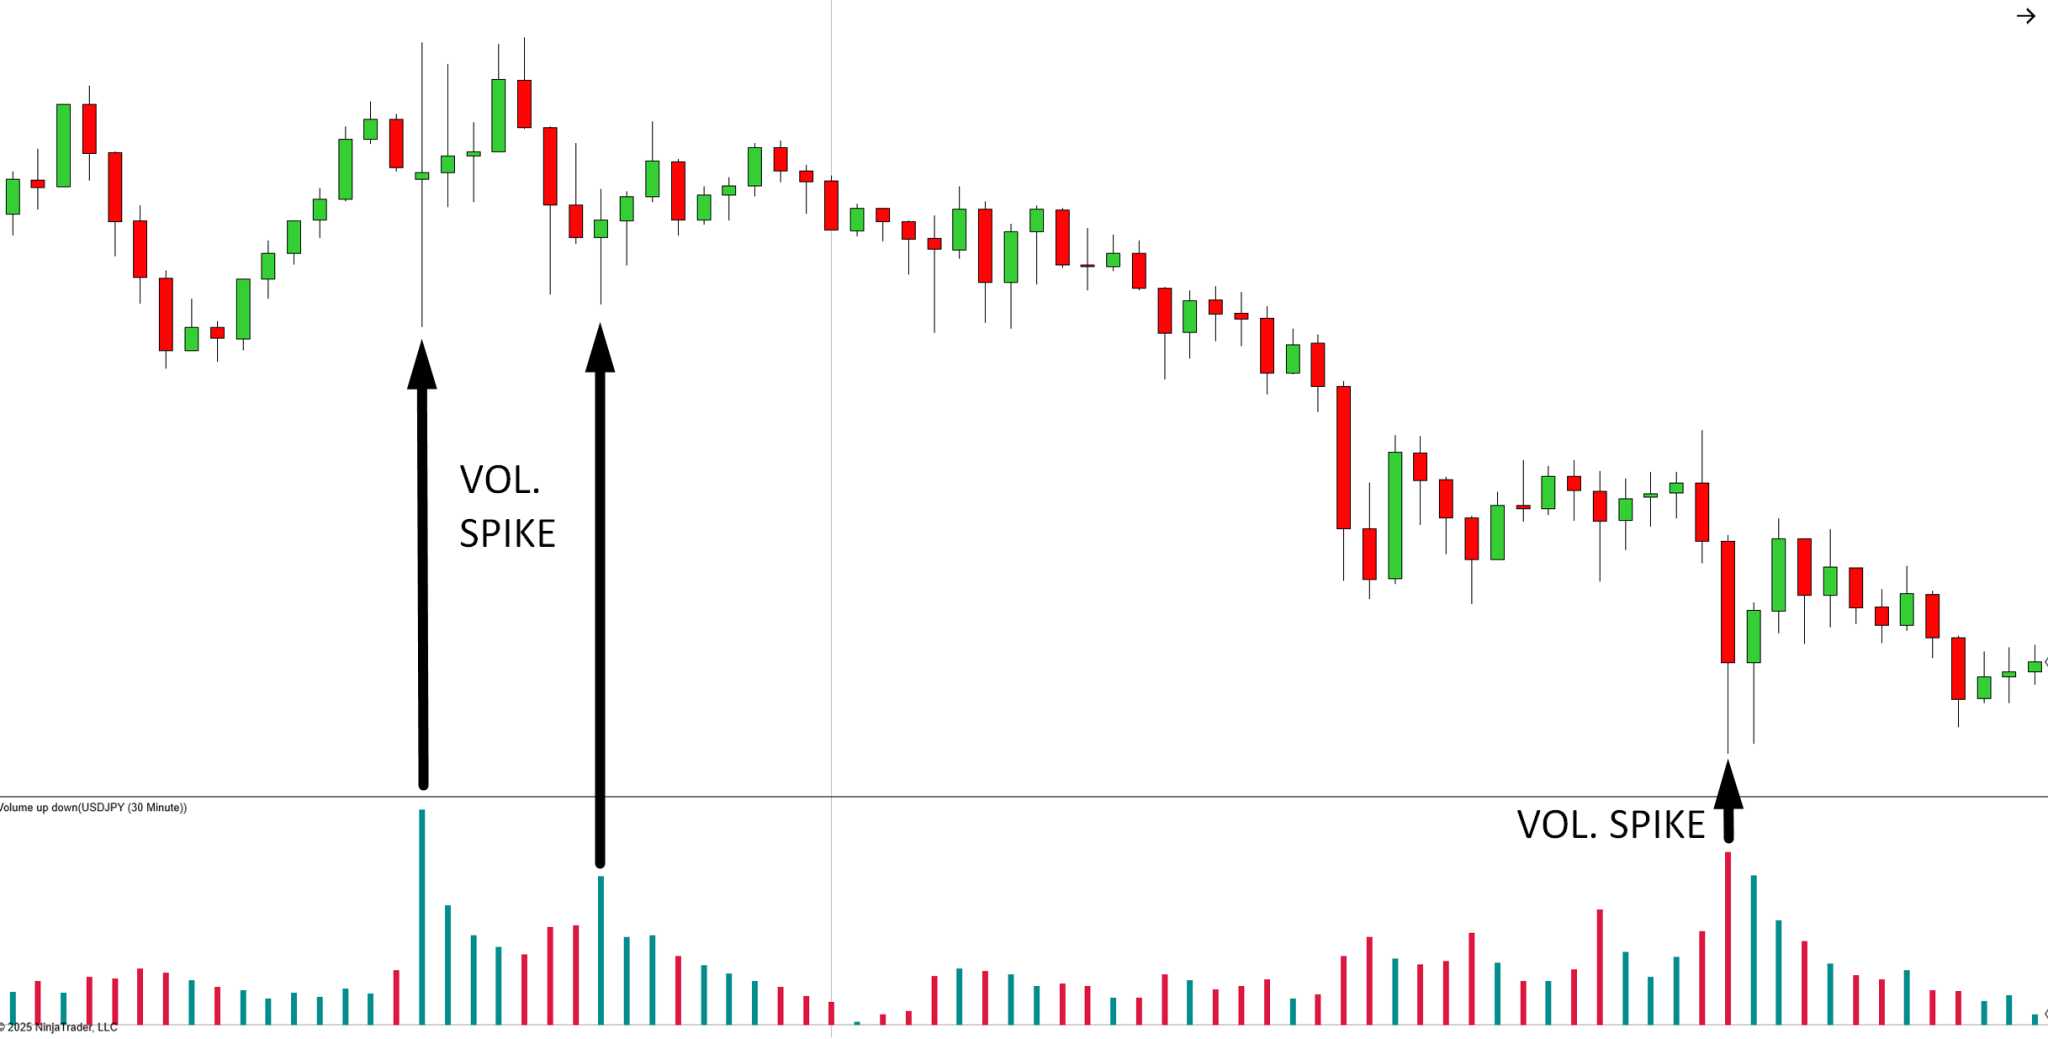
Today I am sharing the first Volume Profile setup I ever traded. It remains one of my favorites because it is simple, logical and based on how large institutions build their positions in the market.
In the video, I’ll show you the full logic behind this setup, how to find it on the chart, and why heavy volume areas often act as strong support or resistance when price comes back to them.
Watch the video here:
www.trader-dale.com/the-volume-profile-setup-that-never-gets-old-19-may-26/
P.S. In honor of Memorial Day, I’m running special 55% discount on my best trading tools and education.
This offer is only available until the end of the month, so if you've been waiting for the right time to upgrade your trading – this is it.
Here is what you can get:
🎯Volume Profile Pack
15+ Hour video course
Daily/Swing trading signals
Volume Profile indicators
VWAP indicator
FREE Tech call & Indicator setup
👑Order Flow Pack:
12+ Hour video course
Order Flow software
Volume Profile software
FREE Tech call & Indicator setup
🚀VWAP Pack
9+ Hour video course
VWAP software
Volume Profile software
FREE Tech call & Indicator setup
💡Smart Money Pack
6+ Hour video course
Smart Money Software
12+ Hours of Live Trading Videos
FREE Tech call & Indicator setup
Get all four packs together and get -55% discount
Get it here:
www.trader-dale.com/volume-profile-forex-trading-course/
OUR IRONCLAD 🛡️MONEY-BACK GUARANTEE:
What makes this sale even better? An ironclad, risk-free money-back guarantee.
You can try everything for two full weeks, if you’re not satisfied for any reason, you get a full refund, no questions asked.
... See MoreSee Less
3 days ago


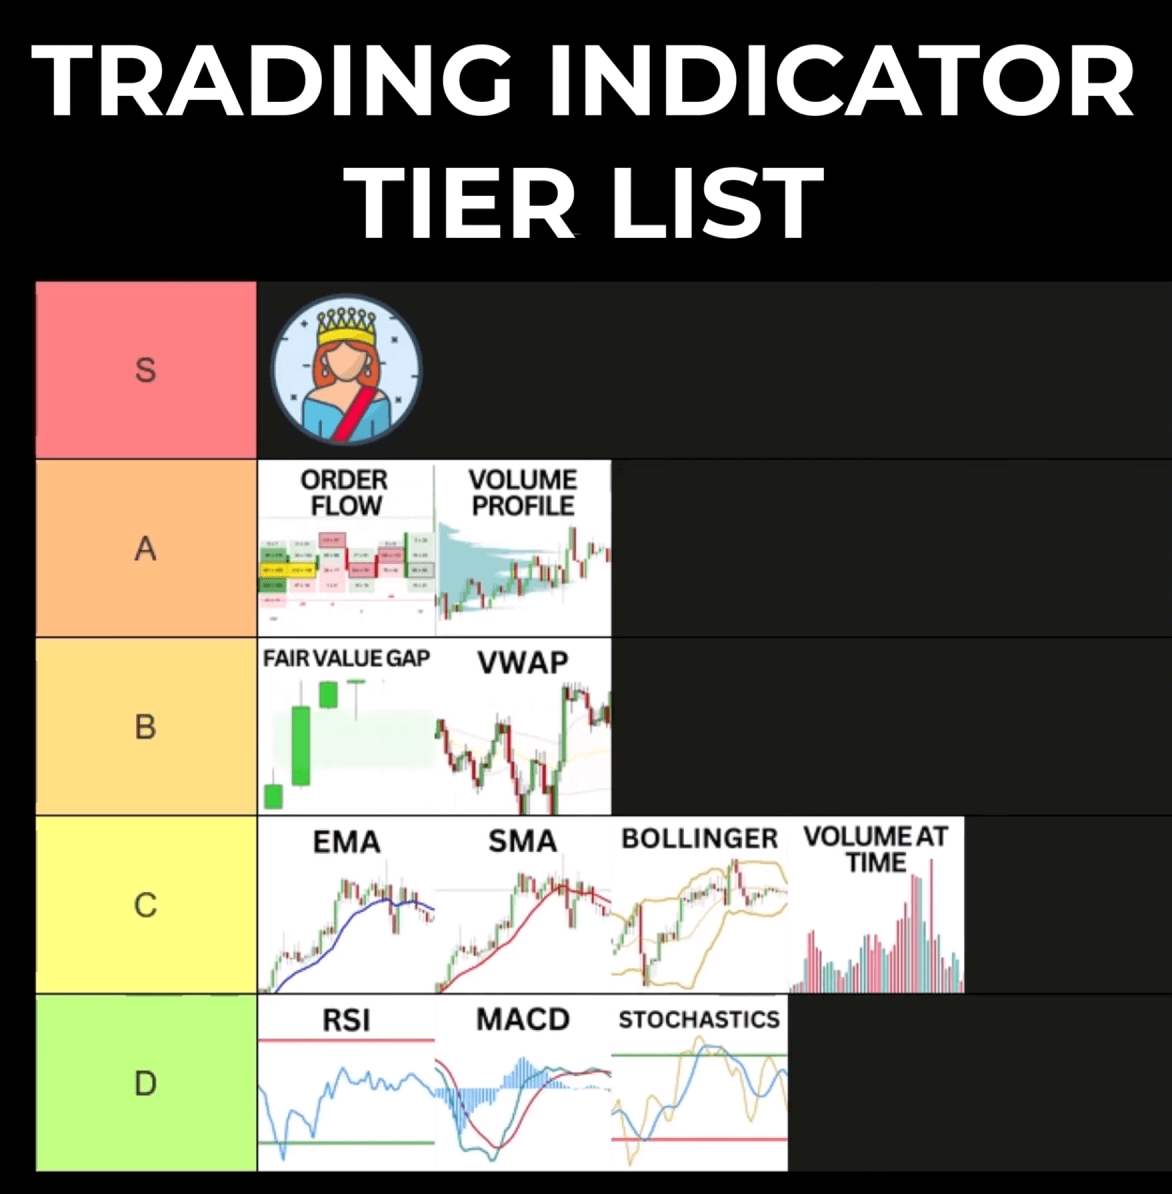
Hi, I just finished your volume profile book. Near the beginning and again at the end you make it clear that “indicators are quite useless”. This was a hard read because I had just finished another book about vwap and only bought your book for a deaper dive into the volume profile aspect. It also occurred to me that volume profile is an indicator. I found myself on your website after a search for my next book led me to your vwap book. I was taken back. Surely this isn’t TraderDale’s book, this man hates inductors! Lastly I was led to this list of your favorite indicators and I’m at a loss.
I don’t know that I have a definitive question, kinda just ‘what gives!?’