
The chart for today is the USD/JPY!
Since the start of the week, the USD/JPY has moved over 100 pips in a pretty rapid sell-off without making any major pullbacks.
When I see such a thing I am always curious of how the volumes got distributed in such a trend.
What I am interested in the most is significant volume areas created within the trend. I call them the Volume Clusters.
Volume Profile analysis
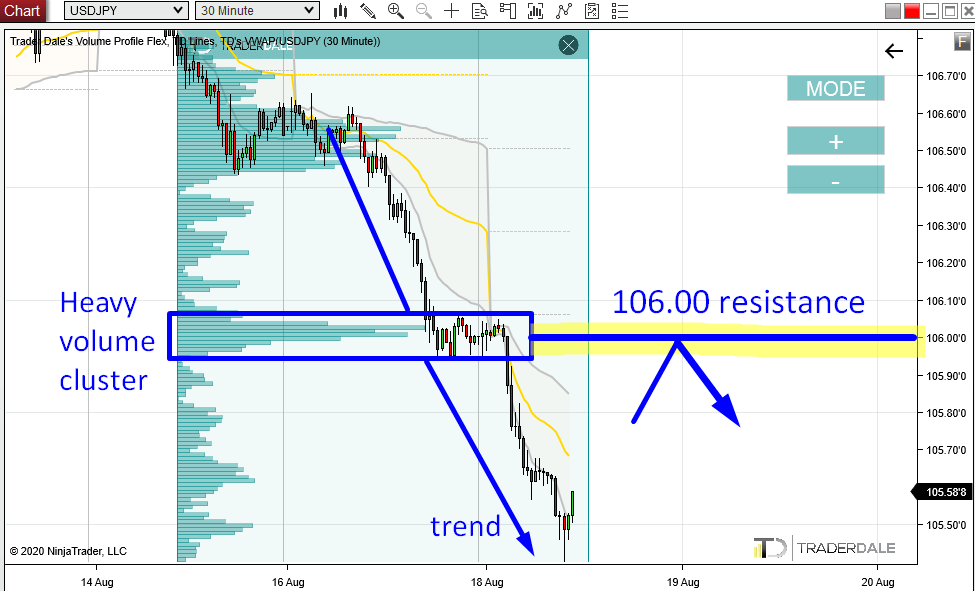
In this case, I used my Flexible Volume Profile tool to look into the volume distribution in the newly formed downtrend on USD/JPY.
I discovered a really significant place, where massive volumes got traded.
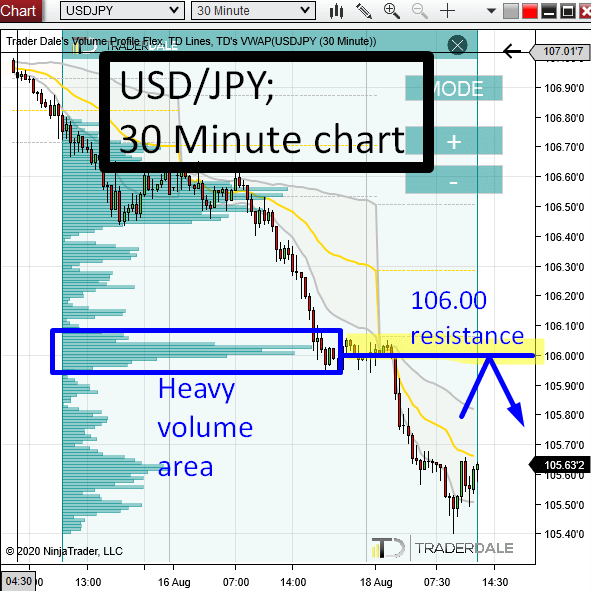
This Volume Cluster was formed around 106.00.
I think that the sellers who are currently pushing the price downwards were adding to their short positions there (around 106.00).
USD/JPY, 30 Minute chart:
Two scenarios likely to happen
What will happen when the price hits this 106.00 area again? There are 2 scenarios that I think will most likely happen.
1. Sellers who were adding to their short positions around 106.00 will start being active again and they will start an aggressive selling. This will result in a reaction to this level and the price will go downwards from there again (the level will work as a resistance).
2. Buyers who push the price upwards – back towards the 106.00 will want to quit their longs somewhere around this area. Why? Because they know that this is a heavy volume area and that there could be strong sellers defending it.
If there isn’t a major change of the sentiment on USD/JPY, then those buyers won’t want to risk a fight with those sellers. It is safer for them to just bank their profits and quit their trades.
What does a buyer need to do to quit his trade? He needs to sell – place a short trade order. Those short trade orders will help the price move downwards from the 106.00 resistance again.
When the price reaches the 106.00 area, then it is likely that a combination of those two scenarios will occur. We can’t tell which scenario will play a stronger role but the important thing is that the result of both of them is the price reacting to 106.00 resistance.
I was talking about those scenarios and the logic behind them some more in this Volume Profile Webinar.
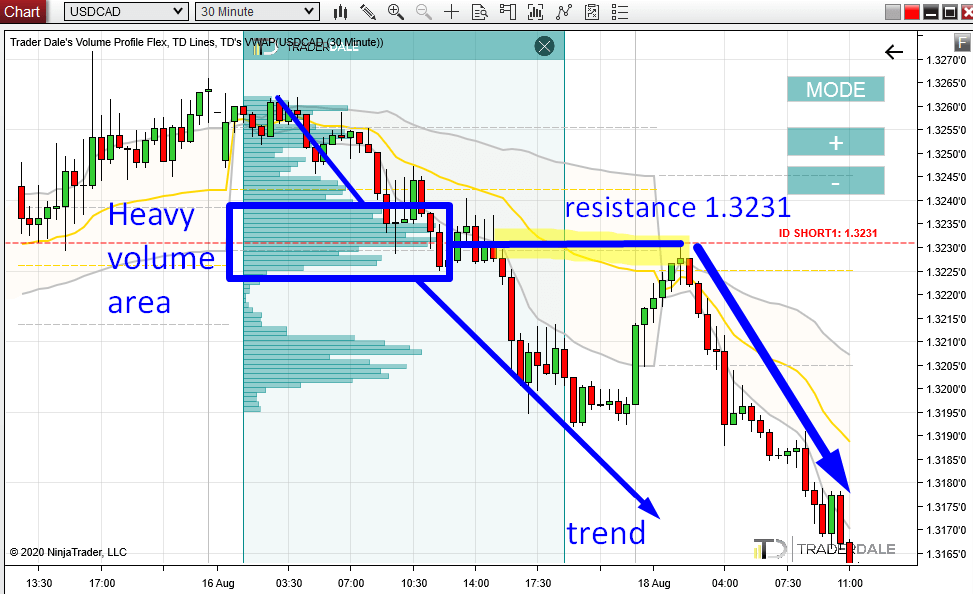
An ideal case
In ideal case the result of this setup should end up like this in the picture below. It shows a trade we had today with members of my trading course on USD/CAD. The logic behind this trade was the same as the one I talked about in this article.
Do you want ME to help YOU with your trading?
A third scenario
I would be mad if I wouldn’t also mention another (not so likely) scenario.
In this scenario, the price simply shoots past the resistance, totally ignoring it.
This third scenario is most likely to happen if there is a change of sentiment in the market.
This would mean that buyers are not afraid of the sellers who are defending the 106.00 area. The reason would be that he buyers have a strong belief (maybe some new, crucial information) that the price should be much higher than it is now.
If the price shoots past the resistance, it is best to go with the flow and take a Reversal trade which should help you to save the day.
Reversal trade
A Reversal trade is a trade in an opposite direction after you got stopped out. You always take the Reversal trade from the same trading level as the previous trade.
This means: If you take a short from 106.00 and get stopped out, then you wait for a pullback and then go long from 106.00).
Reversal trades are based on the logic, that a breached resistance becomes a support (and vice versa).
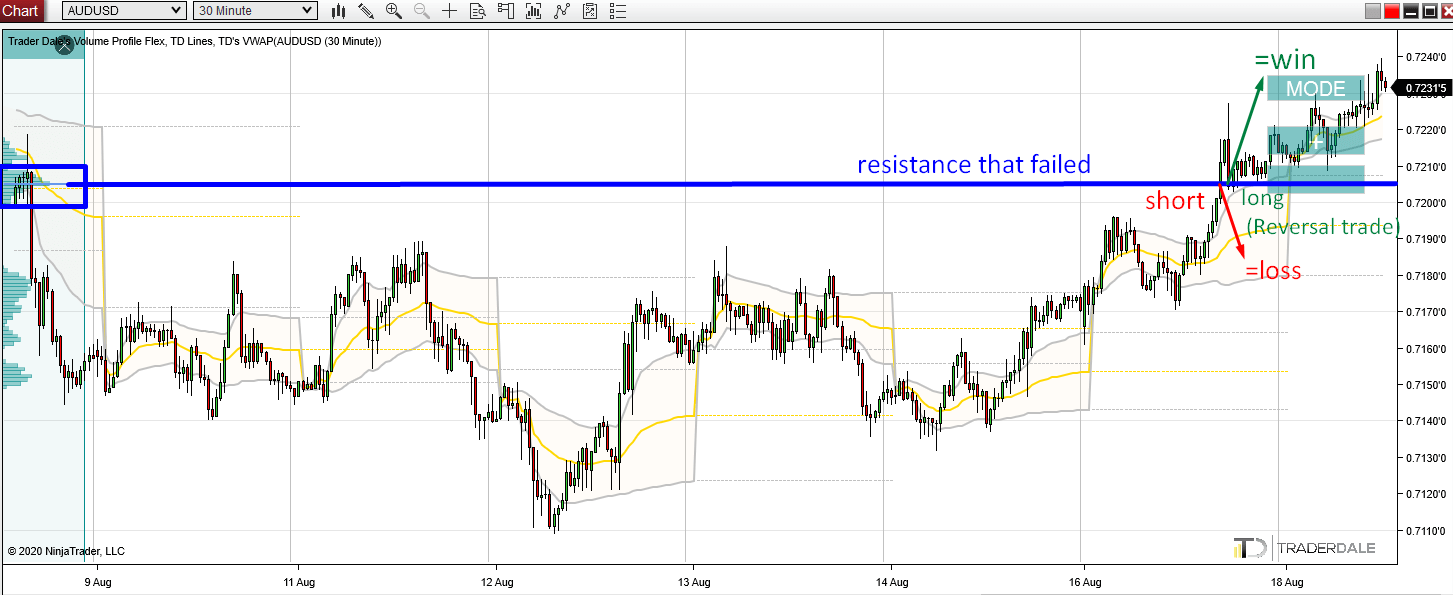
Here is an example of my trade from yesterday:
There was a volume-based resistance on AUD/USD. The price did not react to it and it got breached. I took a Stop Loss there.
Then, when the price moved back to the breached resistance, I entered a Reversal trade (a Long trade). This one ended up as a winner and helped to cover the loss from the previous trade (click to enlarge):

I hope you guys liked today’s article! Let me know what you think in the comments below!
Happy trading!
-Dale
always i learned lot from your every and each articles. volume profile book is the greatest book to follow..thank you very much sir
I’m glad you are learning from them, also thanks for the book feedback, I appreciate it! 🙂
Excellent analysis Dale! Thanks so much for sharing your concepts and insights. It’s much appreciated.
Thank you, you’re welcome!
Great Analysis
thank you!