

Hello guys,
today’s day trading analysis will be on CAD/CHF.
From the bigger perspective, there is now only a rotation. Not much is really happening there. But before this rotation, there was a pretty strong downtrend.
This is something we can work with!
Downtrend means that strong institutional Sellers were pushing the price aggressively downwards. Where did those sellers enter the majority of their Short positions?
Not in the downtrend. There is not much time to enter huge trades when the price is trending. They must have done it before that!
Where? In a rotation. That’s where the BIG guys enter their trades!
Volume Profile Analysis
As you can see from the picture below, there was a rotation before the trend started. I used my Flexible Volume Profile to look at the volume distribution there and I saw that heavy volumes got traded around 0.7476.
CAD/CHF; 30Minute chart:
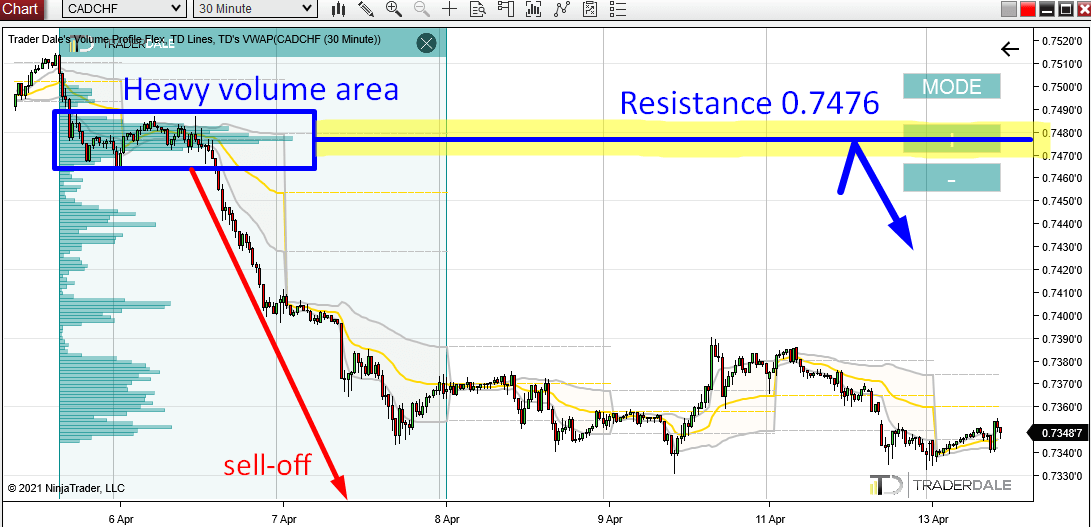
This tells us, that the BIG guys were entering their Short trades mostly around the 0.7476 area. Then they pushed the price downwards.
The heaviest volumes were traded exactly at 0.7476.
This is an information to work with – information that gives us an edge!
When the price makes it back up again at some point in the future, then the Sellers who placed their huge Short trades there (0.7476) will want to defend this place. It is an important area for them (because they placed a lot of their positions there).
When Buyers Quit Longs, They SELL
Now, it is not only strong Sellers defending their Shorts, but there is also a second factor that should help to drive the price downwards from this area.
It is the Buyers. When the price moves up at some point in the future it will be aggressive Buyers driving it up. But when the price reaches the 0.7476 zone those Buyers will want to quit their Longs. The reason is that those Buyers will be afraid of the strong Sellers who placed their Short trades there in the first place.
If you are a Buyer, then you don’t want to try your luck and try to push the price past a strong Resistance. You rather quit your trade there while you are still in profit, right? Unless there is some important change in the market sentiment…
My point is, that when a Buyer quits his Long he needs to Sell. When he sells he helps to drive the price downwards. And that’s the second factor that helps the price move downwards from such Resistances as our 0.7476.
This trading setup is called the “Volume Accumulation Setup“. You can learn more about my volume-based setups here: Simple Volume Profile Setups
I hope you guys liked today’s analysis. Let me know your thoughts in the comments below!
Happy trading,
-Dale
P.S. If you are looking for a solid broker with tight spreads and low commissions then check out my two recommended brokers: Dale’s Recommended Brokers.