

If you have ever watched price rally straight into a resistance level and wondered whether it would actually reverse, you are not alone. Most traders guess. They watch a candle close near an old high and hope for the best. There is a better way. The Volume Profile Cumulative Delta approach gives you a clear, repeatable way to read what is happening beneath the surface of a chart. Instead of guessing, you look at where the heaviest trading has taken place over the week, then you check whether buyers or sellers are actually in control as price returns to that spot.
In this article, you will learn how to combine these two tools using a real trade example on the USD/CAD futures market. We will break down each step so that even if you have never used Volume Profile or Delta before, you will finish this article knowing exactly how to spot the setup, confirm it, and manage the trade once you are in it.
Table of Contents
The Article in 5 Points
- Volume Profile shows you where the heaviest trading volume occurred over a set period, and the Point of Control is the single price level with the most activity.
- Cumulative Delta tracks the difference between aggressive buying and aggressive selling, and it often disagrees with price just before a reversal.
- A divergence between rising price and falling Delta is a strong warning sign that sellers are quietly stepping in.
- Combining the weekly Point of Control with a Delta divergence gives you a high probability entry, as shown in the real USD/CAD trade below.
- Exiting at the first deviation of the VWAP (Volume Weighted Average Price) helped lock in profit before the market could reverse the trade.
What Is Volume Profile and Why the Point of Control Matters
How Volume Profile Turns Trading Activity Sideways
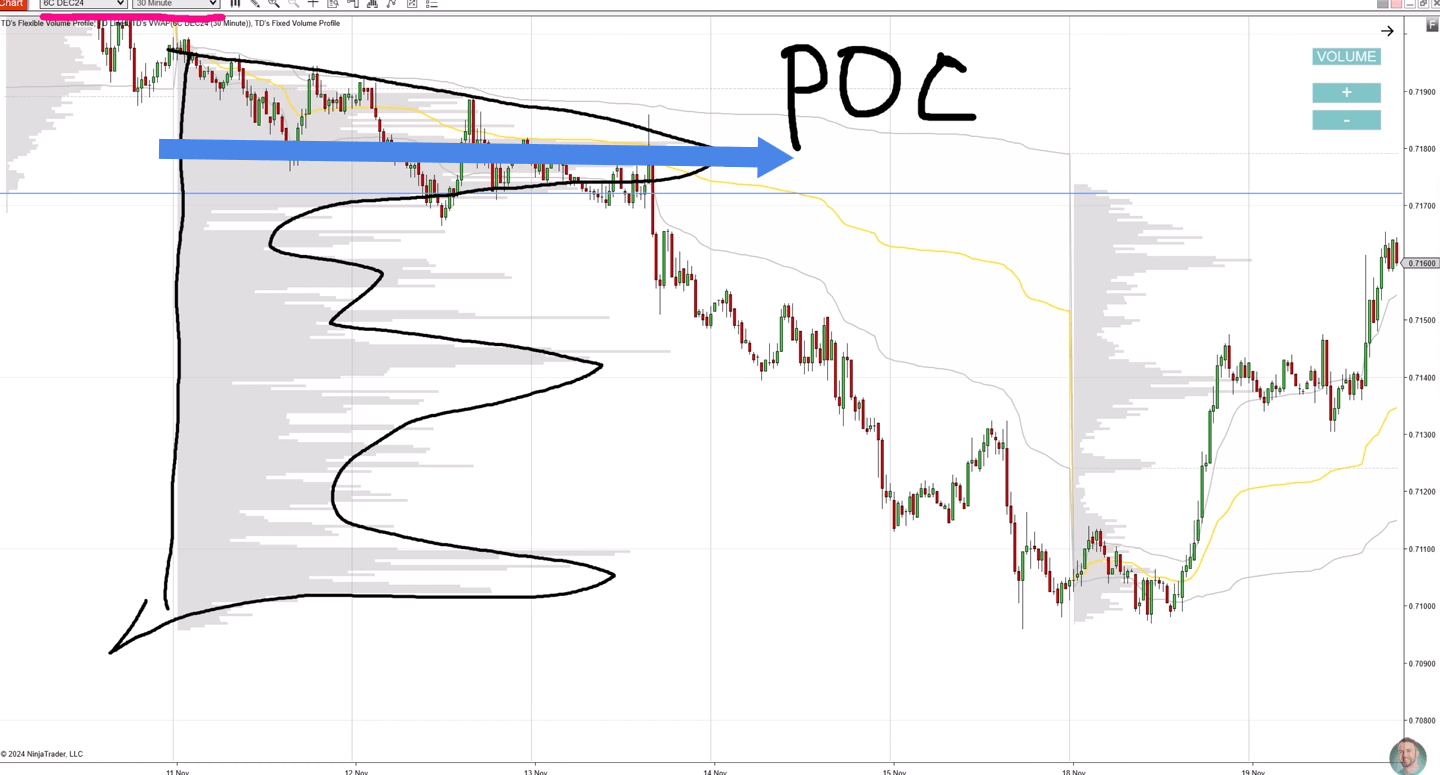
Volume Profile is one of the most useful tools you can add to your charting platform, yet many beginner traders skip right past it. Instead of showing volume along the bottom of the chart as a simple bar for each candle, Volume Profile turns volume sideways. It shows you, price level by price level, exactly how much trading happened at each price over a chosen period of time. Dale uses a weekly Volume Profile, meaning it accumulates every trade from Monday through Friday and stacks that volume horizontally next to the price axis.
The Point of Control as a Magnet for Price
Within that profile sits a single, critically important level called the Point of Control, often shortened to POC. This is simply the price at which the most contracts, shares, or lots changed hands during the period you are measuring. Think of it as the “center of gravity” for that week. A huge number of traders agreed, whether they meant to or not, that this price was fair value. Because so many positions were opened at that level, it tends to act as a magnet. Price is frequently pulled back toward it, and once it arrives, that level often becomes an area of decision rather than a level price simply blows through.
In the trade Dale walks through, the Point of Control formed inside a heavy volume zone on the USD/CAD futures chart. A blue horizontal line marked a resistance level sitting right at the start of that heavy volume area. This is an important detail. Dale was not simply drawing a line at a random swing high. He was drawing it at a level backed by genuine trading activity, which gives the level far more weight than a line drawn purely from visual pattern recognition.
Why Patience Matters Before You Act
Once this level is identified, the next step is patience. You do not chase price. You wait for a pullback, meaning you wait for price to travel back down (or up, depending on the setup) to retest that Point of Control level. Only once price reaches that zone do you begin the next phase of the process, which involves checking Cumulative Delta. This waiting step matters because entering too early, before price actually reaches the level, removes the statistical edge that the Volume Profile is giving you in the first place.
Delta and Why Divergence Is the Signal
Understanding How Delta Is Calculated
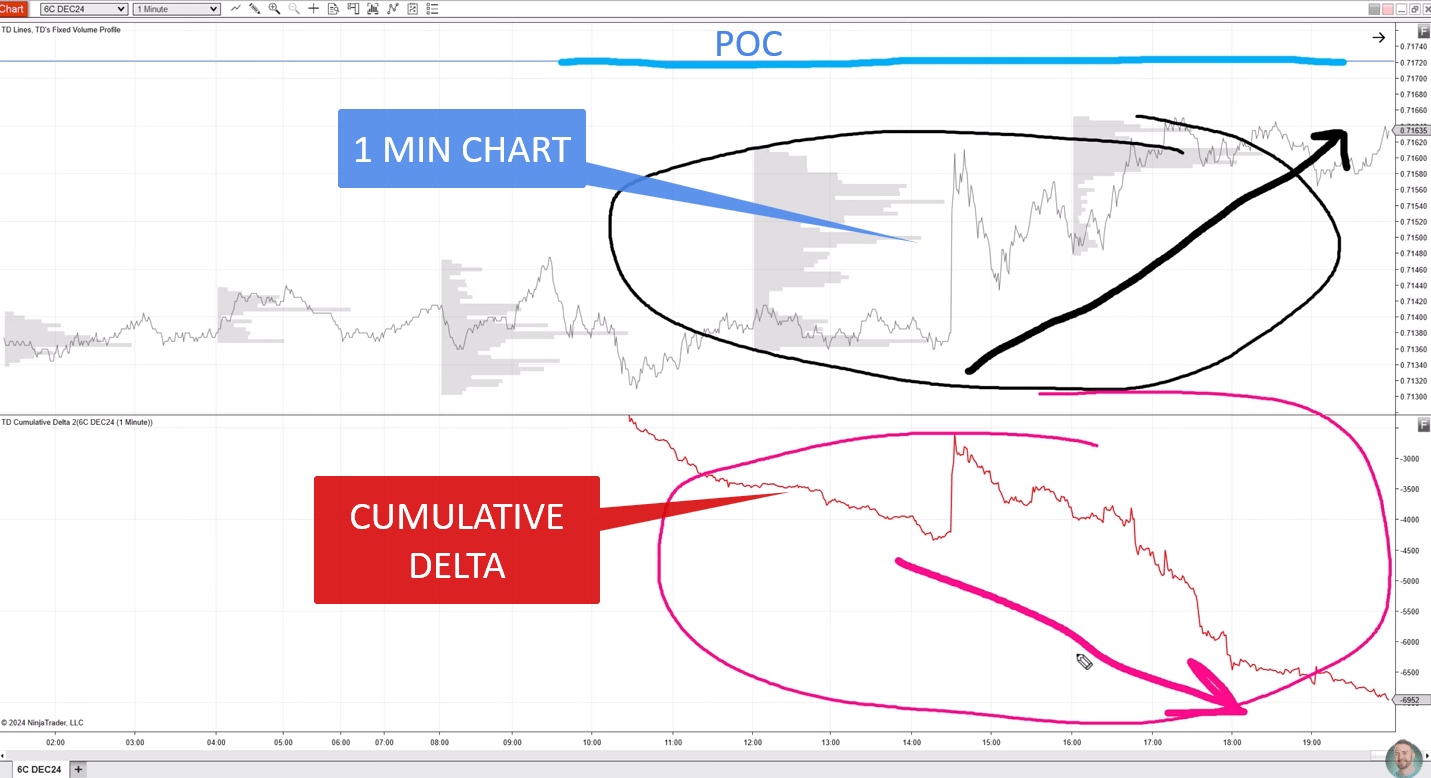
While Volume Profile tells you where the important price levels are, it does not tell you who is winning the fight at that level right now. That is where Cumulative Delta comes in. Delta measures the difference between buying pressure and selling pressure on every single trade. When a trade is executed at the ask price, it is counted as aggressive buying. When a trade executes at the bid price, it is counted as aggressive selling. Cumulative Delta simply adds up this running total over time, creating a line that rises when buyers are more aggressive and falls when sellers are more aggressive.
Spotting the Divergence in Real Time
Here is where the strategy becomes genuinely interesting. Under normal conditions, price and Delta move together. If more aggressive buyers than sellers are active, price should rise, and Delta should rise with it. But sometimes the two disagree, and this disagreement is called a divergence. In the USD/CAD example, as price moved upward toward the weekly Point of Control resistance level, the Cumulative Delta was doing the opposite. It was dropping. On the surface, price looked strong. Underneath, sellers were actually the more active participants.
This divergence is the single most important confirmation signal in this entire strategy. It tells you that the rally pushing price toward resistance is not being driven by genuine aggressive buying. Instead, sellers are stepping in and absorbing the buying pressure, even while price grinds slightly higher. Dale describes watching this divergence build in real time. He did not take any action the moment he spotted it. He simply observed and waited for price to actually reach the resistance level before considering an entry. The divergence alone is not the trigger. The divergence combined with price reaching the level is the trigger.
What Happens Once the Reversal Begins
When both conditions lined up, meaning price had reached the weekly Point of Control and Delta had been diverging the entire way up, Dale knew he had a valid short setup. Later, once price finally reacted and began falling, Delta and price came back into alignment, both moving down together. This is normal. Once the reversal actually happens, the two indicators typically resync, because now the sellers who were quietly active during the divergence phase are now openly pushing price lower.
The Real Trade Setup: USD/CAD 30 Minute Chart
Marking the Level on the Higher Timeframe
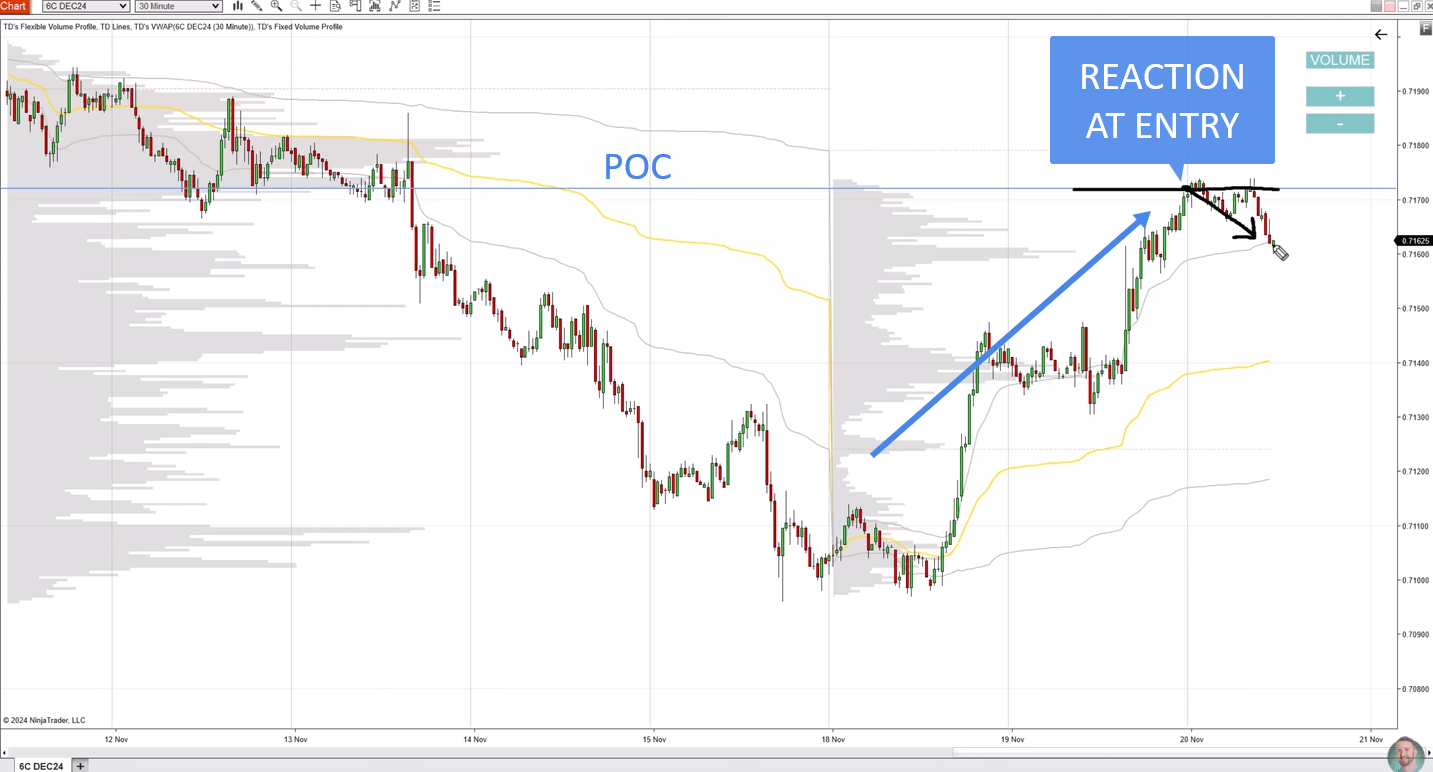
To make this concrete, let us walk through the exact sequence Dale followed on his USD/CAD futures (6C) chart. The setup began on the 30 minute chart, where the weekly Volume Profile was visible along the side of the price action. Dale identified the heavy volume zone and the Point of Control sitting within it. He marked the start of that zone with a blue resistance line.
Waiting Through a Session Without a Clear Reaction
From here, price began drifting upward across multiple sessions, gradually approaching that blue line. This is a normal part of the process and one reason this strategy requires patience. Setups like this do not always resolve within a single trading session. In Dale’s example, the divergence between price and Delta had already been building for some time by the point price actually touched the resistance line, and the trading day ended before a clear reaction occurred.
Rather than force an entry, Dale waited for the next session. This is worth repeating because it is a common mistake among newer traders. When a level is important, it deserves patience, not urgency. On the following day, price finally reacted to the resistance level. At the same moment, Delta began dropping in a much more obvious way, no longer just diverging quietly but now actively falling alongside the emerging price reversal. This alignment between the reaction at the level and the shift in Delta behavior was Dale’s final confirmation that the trade idea had played out as expected.
Timeframes for Context and Confirmation
It is worth noting that a 30 minute chart was used to identify the broader structure and the resistance zone, while a 1 minute chart was used to actually observe the divergence in fine detail. This combination of a higher timeframe for context and a lower timeframe for confirmation is a useful habit to build regardless of which specific strategy you are trading.
Reading the Divergence Between Price and Delta
What a Normal Move Looks Like Versus a Divergence
Let us slow down and look specifically at how to read a Delta divergence on your own charts, since this is the part traders often find confusing the first time they try it. Open a Cumulative Delta indicator beneath your price chart. As price moves, watch whether the Delta line is making higher highs alongside price, or whether it is failing to keep up.
In a healthy, non-divergent rally, both price and Delta climb together in a fairly consistent pattern. In a divergent rally, price continues stepping higher, but Delta either flattens out or actively declines. This mismatch is the market’s way of showing you that the visible price action does not match the underlying order flow. Bold this concept in your mind: rising price with falling Delta usually means hidden selling, and falling price with rising Delta usually means hidden buying.
A Quick Reference Table
Scenario | Price Action | Delta Action | What It Suggests |
Normal Bullish Move | Rising | Rising | Genuine buying pressure, trend likely to continue |
Bearish Divergence | Rising | Falling | Sellers absorbing buyers, possible reversal ahead |
Normal Bearish Move | Falling | Falling | Genuine selling pressure, trend likely to continue |
Bullish Divergence | Falling | Rising | Buyers absorbing sellers, possible reversal ahead |
In Dale’s trade, the setup matched the Bearish Divergence row exactly. Price rose toward the weekly Point of Control while Delta fell the entire way, which is precisely the signature you want to see before considering a short entry at a resistance level identified through Volume Profile.
Exiting the Trade Using VWAP Deviations
What the First Deviation Band Represents
Finding a good entry is only half of any trading strategy. Managing the trade and knowing where to exit matters just as much, and this is a step many educational articles skip entirely. Dale exited his short position at the first deviation of the weekly VWAP, shown on his chart as a gray line sitting below price.
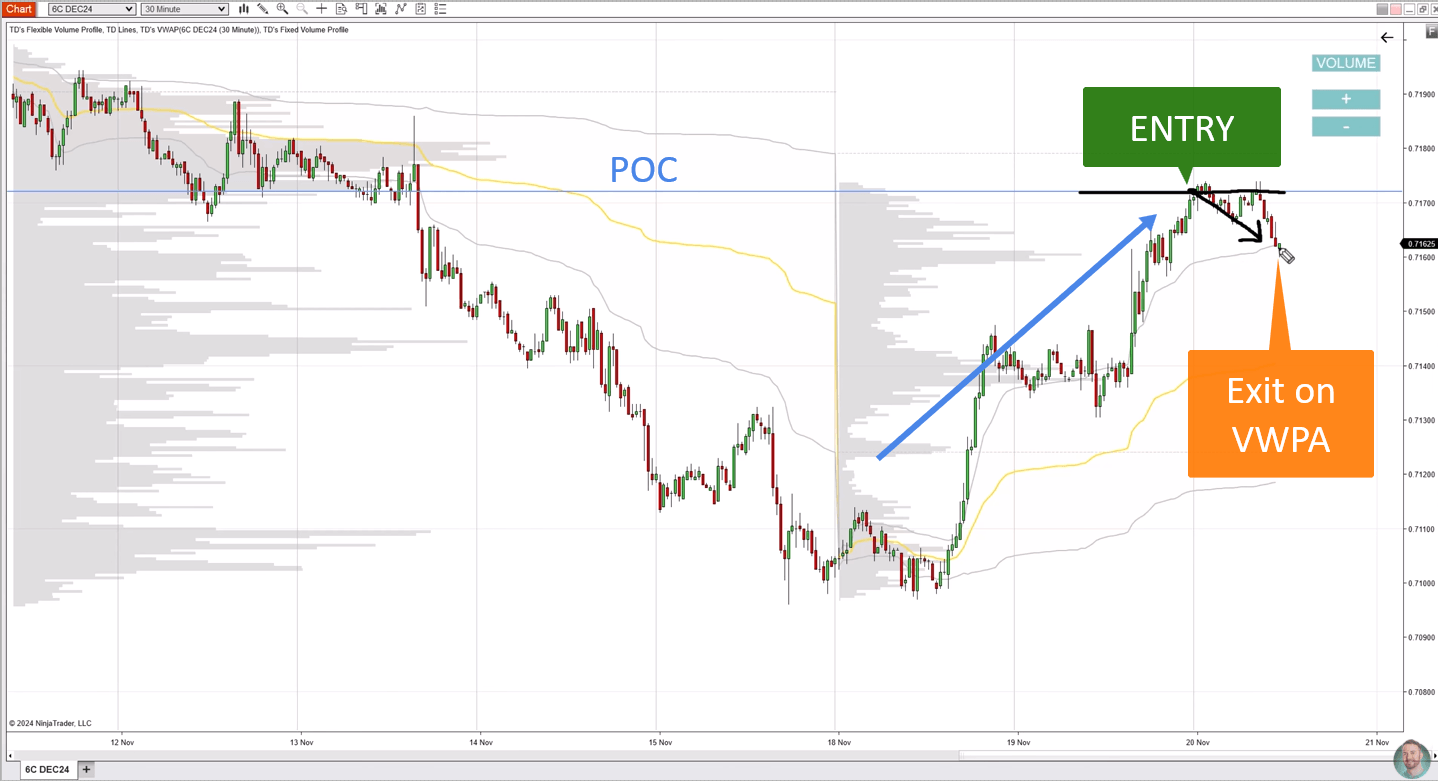
The VWAP, or Volume Weighted Average Price, is a running average of price weighted by the volume traded at each price point. Around this average, most platforms allow you to plot standard deviation bands, similar to how Bollinger Bands work around a moving average. The first deviation band is often the first area where price pauses or reacts when the market is trending strongly, because it represents a statistically significant move away from the average.
Why Dale Chose to Exit Early Rather Than Hold
Dale noted that earlier in the same trend, price had already demonstrated this exact behavior. It moved above the first deviation, pulled back to it, and reacted. Recognizing that pattern gave him confidence that the same gray line would likely produce another reaction, which is exactly what happened. When his short position reached that level, he closed the trade rather than holding out for a larger move.
Two additional factors reinforced his decision to exit at that specific point. First, there was a small Fair Value Gap nearby, and price often reacts to these gaps because they represent an area where trading moved so quickly that a temporary imbalance was left behind. The bottom of that gap posed another potential turning point that could have worked against his position. Second, simply staying in the trade longer without a strong reason would have added unnecessary risk. Locking in a solid, logical profit is almost always smarter than gambling for an extra few pips.
Putting It All Together: A Simple Three Step Checklist
By now you have seen every piece of the puzzle individually, so let us compress the entire Volume Profile Cumulative Delta approach into a simple checklist you can actually use on your own charts.
- Step One: Find the Zone. Pull up a weekly Volume Profile and locate the heaviest volume area along with its Point of Control. Mark the edge of that zone as a potential resistance or support level.
- Step Two: Wait and Watch Delta. As price approaches your marked level, switch to a lower timeframe and watch the Cumulative Delta. You are looking specifically for a divergence, meaning price is moving toward the level while Delta is moving the opposite direction.
- Step Three: Confirm and Manage. Once price actually reaches the level and the divergence has been building, you have your confirmation to enter. From there, use tools like the VWAP deviation bands and nearby Fair Value Gaps to plan a sensible exit rather than holding blindly.
This three step process removes a lot of the guesswork that trips up newer traders. Instead of reacting emotionally to a single candle, you are building a case using volume based evidence, checking whether that evidence is confirmed by order flow through Delta, and then managing risk using objective reference points like VWAP.
Conclusion
Combining Volume Profile and Cumulative Delta gives traders a genuinely practical way to see beyond the surface of price action. Rather than reacting to candles alone, you are learning to identify a meaningful level using real trading volume, then confirming whether the move toward that level is backed by genuine strength or hidden absorption using Delta.
In the USD/CAD example walked through in this article, price rallied toward a weekly Point of Control while Delta quietly diverged the entire way, giving a clear signal that sellers were building pressure beneath the surface. Once price reacted, Dale managed the trade sensibly, exiting at the first VWAP deviation rather than risking a reversal.
Ready to Go Further?
- Head over to Trader-Dale.com and click the button labeled “FTA” (Funded Trader Academy).
- Watch the free explainer video to see exactly how the academy works.
- Join Dale and other funded prop traders in a live trading room every day.
Frequently Asked Questions
Does this strategy work on any market, or only USD/CAD futures?
The concept behind combining Volume Profile with Cumulative Delta applies to any liquid market where volume data is available, including other futures contracts, major forex pairs traded through futures or certain brokers, and stocks. The specific example in this article used USD/CAD futures, but the underlying logic of finding a heavy volume zone and watching for a Delta divergence transfers across markets.
What timeframe should I use for the Volume Profile and Delta?
Dale used a weekly Volume Profile alongside a 30 minute chart for the broader structure and a 1 minute chart to closely observe the Delta divergence. You can adjust these timeframes depending on your trading style, but keeping a higher timeframe for context and a lower timeframe for entry confirmation is a good general habit.
What if price reaches the level but Delta does not diverge?
If price simply pushes through a level with Delta confirming the same direction as price, that is a sign of genuine strength rather than hidden absorption. In that case, the setup described in this article does not apply, and chasing an entry against that strength is generally not advisable.
