
This article is a part of “Stock trading with Volume Profile” 3-part miniseries. Here are links to all related posts:
Stock Trading With Volume Profile #1 (NIKE)
Stock Trading With Volume Profile #2 (APPLE)
Stock Trading With Volume Profile #3 (TESLA)
In my previous article, I was talking about stock trading with Volume Profile. The analysis I did in that article was on the sportswear company Nike.
In this article, I will continue on what I showed you the last time and do another analysis, this time on Apple.
A couple of days ago Apple revealed their new iPhone 12. I admit I quite like it – especially the new camera. But do I buy their stock just because I like their new iPhone? Absolutely no.
- I buy an iPhone because I want to make calls, text, use a camera, use some apps, etc … that’s it.
- I buy Apple stock because I want to make money on it.
Those are two different things and you should approach them differently.
You first look at the chart, the numbers, and only then maybe on their new shiny product (which does not really have the potential to move the price of Apple stocks too much).
Let’s now have a look at the chart!
APPLE: Volume Profile chart analysis
As I told you in my previous article, I use mostly Daily time frame to analyze stocks.
There was a strong uptrend on Apple (AAPL). When I see an uptrend like this I use my Flexible Volume Profile to look into that uptrend to see how volumes were distributed there.
Mostly, I look for significant Volume Clusters (heavy volume areas that stand out).
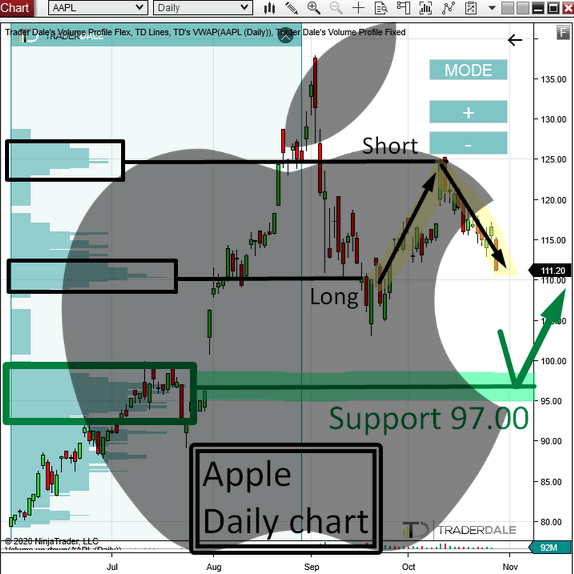
The recent development shows three significant Volume Clusters in the immediate area. I marked them with rectangles in the picture below:

Resistance 125.00 (already tested)
The highest Volume Cluster was around 125.00. As you can see the price nicely reacted to it – it worked as a Resistance. The current selling activity is a reaction to it.
The Volume Profile setup to identify this short trade opportunity is called the “Rejection Setup“. You can read more about it for example in my Volume Profile book which you can download here on my website for free.
So, the 125.00 short level is already spent. There was a nice and precise reaction to it.
Support 110.00 (already tested)
Another significant Volume Cluster (the one in the middle) was around 110.00. The price has already reacted to it and went upwards from there. The setup behind this long level is called the “Trend Setup“.
*BTW. the best place to quit the Long trade based on the 110.00 Support was at 125.00. Why? Because 125.00 was a volume-based Resistance.
Support 97.00
This leaves us with the last Volume Cluster – with its volume peak around 97.00. This one is the most significant one, in my opinion.
The reason is that there were massive volumes traded, and that really strong uptrend started from there. Also, as you can see there was a gap which I think will get filled and then the price will shoot upwards.
However, the gap is not the main reason why I think the price will go upwards from there. It is the heavy volume area (Volume Cluster). It indicates that heavy institutional volumes were traded there – big guys were adding to their Long positions.
When they were done with that, they started to push the price aggressively upwards.
The zone, where they placed most of their Long positions is important for them. If the price comes back to it again, then it is likely that they will become active and they will start defending this area (by aggressive buying).
This is the main reason why I think this zone around 97.00 will work as a strong support.
Do you want ME to help YOU with your trading?
Fundamental analysis
The Volume Profile analysis is quite enough for me to base my trading decisions on.
It is difficult for some people to understand, that I am able to trade without looking at fundamentals. At first, it was also hard for me to more or less completely let go of the fundamentals in my trading (since I was basically raised in the university to do mostly just the fundamentals).
But for those who like to dig some more into the fundamentals and to learn something about the company they are trading, here are some basic tips to look for.
Some of them I gave you in my previous article, so let me continue where I left…
In my opinion, the best and quickest way how to learn about the fundamentals is to go to finviz.com and look up your stock there.
There are three tables I want to comment on.
Simplified financial statement
The first one gives you the financial overview of the company – the numbers. There are a lot of them, but only a few are actually useful. Which are most useful? This depends on the company, the industry and what exactly you are looking for.
Here are some important ones: Dividend %, P/E, P/B, ROA, ROE, ROI.
*Click picture to enlarge

Analyst recommendations
Below that, there is a table with analyst recommendations. How this works is that analysts from big banks are asked to do their analysis on the given stock. They tell us if they think the price will go up or down and what the target should be.
I am writing about this only to warn you NOT to use this. There is absolutely no edge in following their opinions. You can as well toss a coin and you won’t fare worst than them. These guys are simply not good at their predictions. They are unreliable. I know this sounds maybe a bit critical from me, but it is my experience.
*Click picture to enlarge

“Insider Trading” table
What I find quite useful is the “Insider Trading” table. This shows what the important people in the company do with their shares.
This can definitely be helpful. Just look at the table below – most guys are selling their AAPL shares now. If you look at the chart, you can see how nicely it corresponds with it.
This is not a Holy Grail though (but not a bad indicator either!). Sometimes you can get the wrong picture.
For example: A CEO who is selling his stocks does not necessarily mean that he does not see a good future of the company. It could for example mean that he just wants to buy a new house, boat, business, diversify portfolio, … It does not need to mean that the company is bad. Also it does not mean he is selling all his shares! He can be selling for example just 5% of them…
I am telling you this so you don’t rely solely on this table.
*Click picture to enlarge

I hope you guys liked this article. Let me know what you think about the new iPhone as well as on the article in the comments below!
Happy trading!
-Dale
P.S.This article is a part of “Stock trading with Volume Profile” 3-part miniseries. Here are links to all related posts:
Stock Trading With Volume Profile #1 (NIKE)

Thank You Dale.
Will take note of the $97 price level to prepare in going long.
You’re welcome Adrian, good luck. 🙂
Apt analysis as usual. But can you please recommend a good meta trader 4 broker that trade aapl? And am looking forward to your comprehensive analysis of the upcoming US elections on fx and other trading instruments. Thanks!
Hi Tim, you can trade stocks with IC (http://icmarkets.com/?camp=11446).
Well, the fact about elections and outcomes to FX is very unpredictable. I think it is just best to sit this one out and just watch.