
This article is a part of “Stock trading with Volume Profile” 3-part miniseries. Here are links to all related posts:
Stock Trading With Volume Profile #1 (NIKE)
Stock Trading With Volume Profile #2 (APPLE)
Stock Trading With Volume Profile #3 (TESLA)
In today’s analysis, I will give you a quick guide on analyzing and trading stocks with Volume Profile. I am going to focus on long-term investments, not day trading.
Pick a high-quality stock
The first thing you need to do is make sure that you pick high-quality stock for your trading. The rule of thumb is to pick any company that is listed in any of the prestigious stock indices like S&P 500, Dow Jones, Euro Stoxx,… Those stocks are called “Blue-chips”.
The main reason for picking Blue-chips is that those companies are more stable, more predictable, and very importantly they have good liquidity.
NinjaTrader 8 platform has those stocks listed by default here:
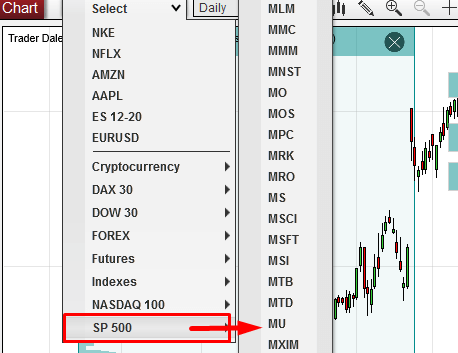
For today’s analysis I picked Nike – a strong sportswear company that needs no introduction.
I did not pick this company because I would be a huge fan of their products, but simply because it is a big company with a good market share and liquidity.
I want to make money on the price movement of the stock, not on selling their shoes…
NIKE – Volume Profile analysis
What i really like about Volume Profile is it’s versatility. You can use it for almost any trading instrument and the best thing is that you always do it the same way. The strategy and setups are the same regardless of what you trade.
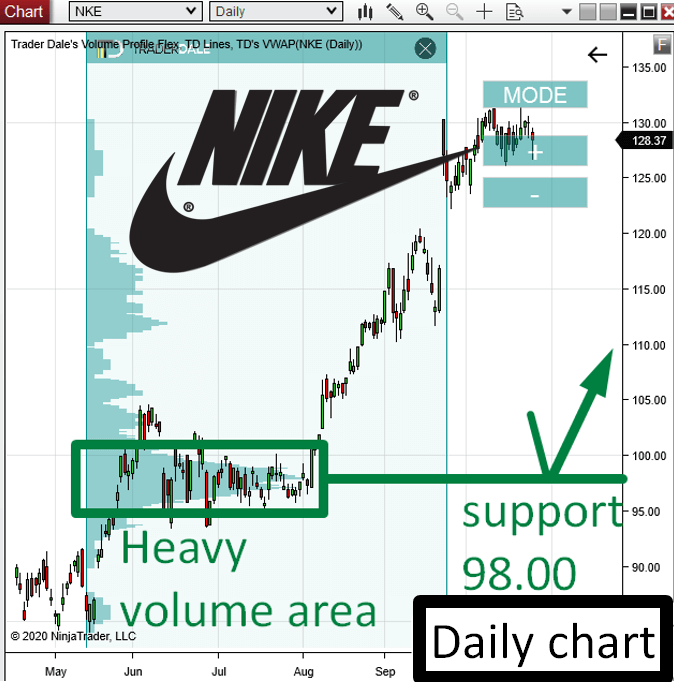
In this case I did my analysis on Daily chart (you can also do this on Weekly).
From July to August the price of Nike was in a rotation. The price created a flag and the rotation was becoming tighter and tighter.
The tighter the rotation becomes, the higher chances it will shoot aggressively up or down from there.
And this exactly this happened in the beginning of August. The tight price channel broke, and the price shot upwards, starting a new trend.

NIKE – Point Of Control (POC)
I used my Flexible Volume Profile to look inside the rotation area to see how the volumes were distributed there.
It showed that there were massive volumes traded in that rotation, and that the Point Of Control (place with the heaviest volumes traded) was at 98.00. This is an important information because this is the place where most of the trading took place.
I expect that the big trading institutions (banks, hedge funds, pension funds,…) were building up their massive Long positions there.
When they finished doing so, they started to push the price aggressively upwards into a new uptrend.
When the price makes it back and tests the POC at 98.00 I think that those big institutions will become active again and that they will drive the price upwards again.
POC is very important level for them because they have placed most of their positions there. They will defend it, and for this reason it should work as a strong Support.
So what now? Now we wait until the price comes back to 98.00. You can set a pending order there, so you don’t miss the trade entry when the price makes it to 98.00.
Do you want ME to help YOU with your trading?
Datafeed
A cool thing NinjaTrader 8 platform has is a free End-Of-Day datafeed. You don’t need more for this kind of long-term investments.
You just connect to the datafeed by clicking here:
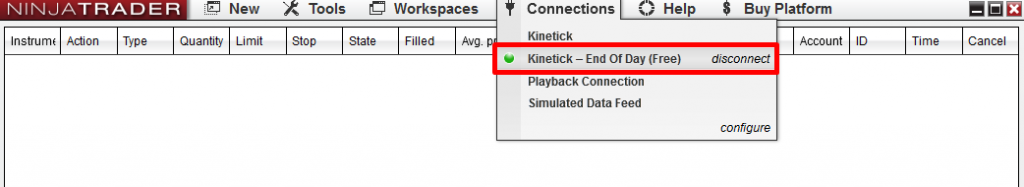
This connection won’t give you tick data which you normally need for intraday trading. In fact, the volume information it provides is very limited.
This would be really insufficient for day trading, but it is more than enough for swing trading and long-trading investment.
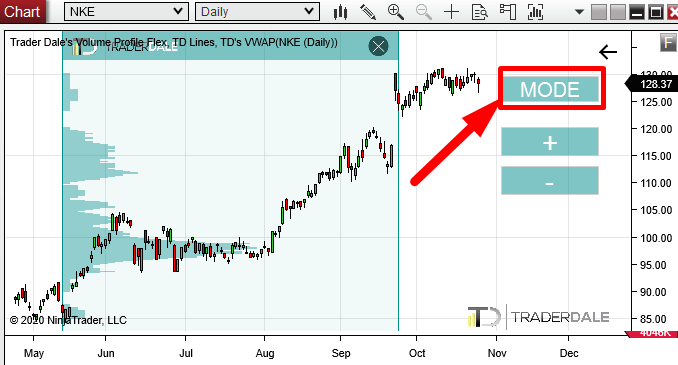
With this datafeed I don’t use Volume calculation, but I use TPO calculation. You can switch between those two at the top right corner of your chart (you need to load my Flexible Volume Profile first).
Summary
- Connect to End-Of-Day datafeed and switch to Daily or Weekly time frame.
- Pick a “Blue chip” stock from S&P 500, or any prestigious equity index.
- Use my Flexible Volume Profile (switch it to TPO) to analyze the chart. Look for my standard Volume Profile trading setups.
- Set pending orders so you don’t miss your trade entry.
I hope you guys liked the article. Let me know what you think and if you are into trading stocks or if you prefer currencies, futures, or something else.
Happy trading!
-Dale

This article is a part of “Stock trading with Volume Profile” 3-part miniseries. Here are links to all related posts:
Stock Trading With Volume Profile #1 (NIKE)
Very informative Dale.
I appreciate the effort you put into educating us.
John
Thank you!
Nice
Is it possible to do for AAPL?
Thank You
Thanks, yea I think I can!
but what about Dark pool in those big liquidite stocks we can’t all the real volume
Not all, that’s true. But this does not matter too much. It correlates heavily.
Hi Dale – What is the difference between TPO and Volume Profile? What does one lose or gain by using one vs. the other?
Thanks for all the educational tips you provide.
Hi Aditya, TPO shows us how much time the price spent at a particular level, and the Volume Profile shows us how much volumes got accumulated at that particular level. They tend to be similar, but I’d definitely recommend trading with the Volume Profile because that’s the real data you need.