
This article is a part of “Stock trading with Volume Profile” 3-part miniseries. Here are links to all related posts:
Stock Trading With Volume Profile #1 (NIKE)
Stock Trading With Volume Profile #2 (APPLE)
Stock Trading With Volume Profile #3 (TESLA)
In today’s post, I am going to talk about Tesla (TSLA) stock. This stock and revolutionary company is now very popular. It’s price skyrocketed (pun intended) in 2020 from $80 to $500. Isn’t that crazy for a regular stock?
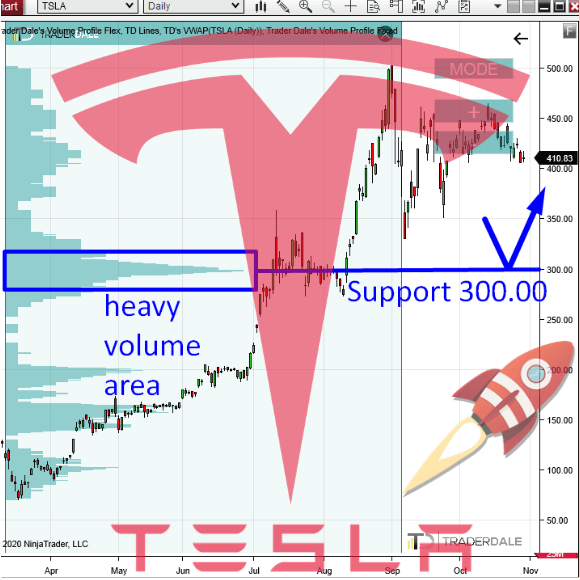
Crazy or not, here is the Tesla on a Daily chart:
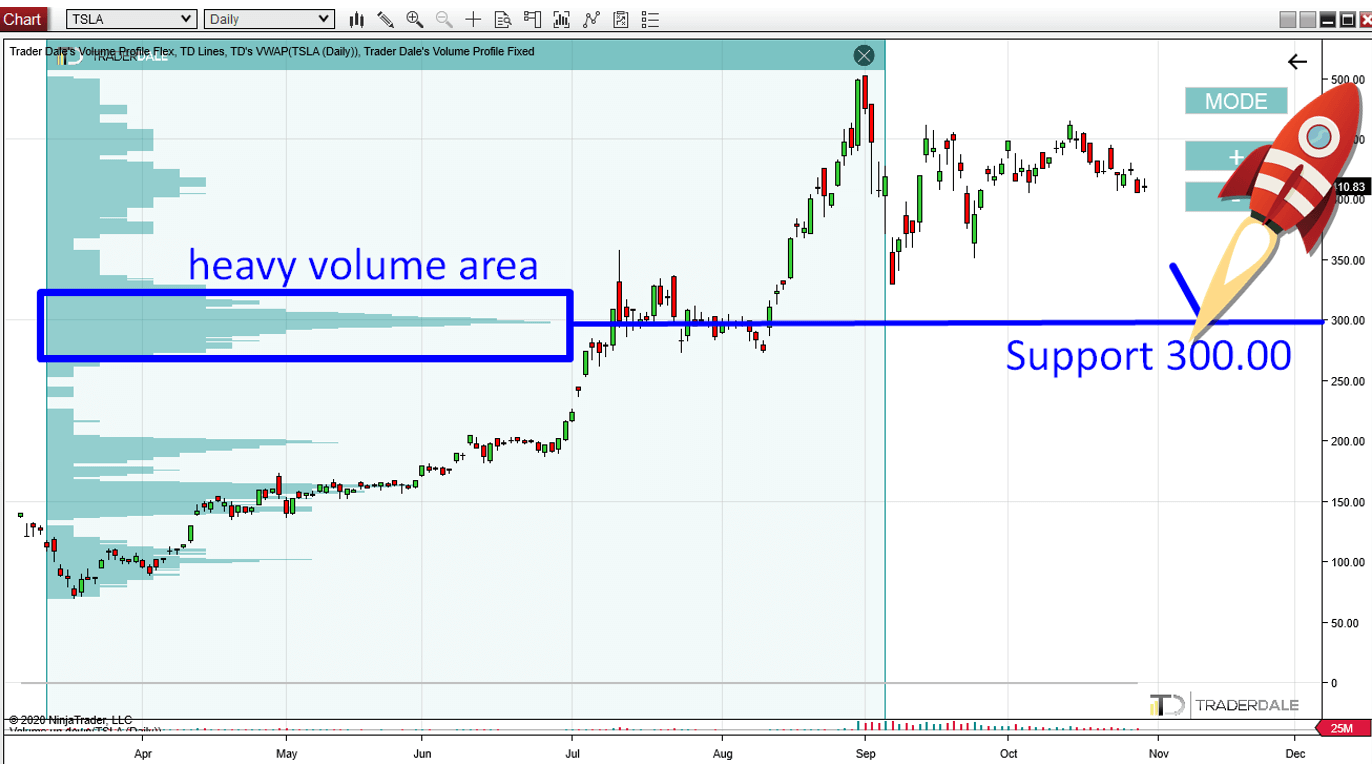
TESLA: Support around 300.00
There is a pretty interesting zone in the chart. It is a heavy volume area which got formed in July around 300.00.
I think that those heavy volumes that you can see on the Flexible Volume Profile were volumes of strong buyers. Those buyers were adding to their longs there, creating those heavy volumes.
Then they pushed the price even higher, into a crazy strong uptrend.
Now there is a rotation which gets tighter and tighter. But when the price starts to move more again (maybe after the US presidential election?) and if it hits the 300.00 area then I expect that there will be a buying reaction. A buying reaction from the big institutional buyers who were building their Long positions around 300.00.
The 300.00 is the local Point of Control (POC) – that’s the place where most of the volumes got traded. It is usually a very important place in any chart.
Do you want ME to help YOU with your trading?
TESLA: Support around 200.00
Another important price level to notice is the 200.00 (BTW. both these supports are nice round numbers).
This one is based an a Volume Cluster created within a trend. The logic is very similar to the 300.00 Support (Volume Profile – Trend Setup). The volumes that were traded there were not so heavy though.
To make up for this, there is one more confluence there. It is a confluence with a Price Action setup, which says that a breached Resistance becomes a Support.
As you can see from the chart below, the price nicely reacted to the 200.00 level in the past with a strong rejection. Because of this we know that it was a strong Resistance.
Now, when the price shot past the former Resistance, it became a Support.
It is the combination of the Volume-based setup and the Price Action-based setup that I like the most about this level.
Tesla, Daily chart:

That’s it, guys. I hope you liked today’s Tesla analysis. Let me know your thoughts in the comments below!
Happy trading!
-Dale

Hey Dale
You always says those buyers.But those buyers are buying more.
Why do they buy more if they already bought?
Basic. To have more position. Financial leverage.
Hey Dale
You always says those buyers.But those buyers are buying more.
Why do they buy more if they already bought?
Big institutions need to allocate huge amounts of capital. They are always looking for places where they can do it – places with big liquidity.
Thank you Dale.
If they are buying at $300, will the price still goes to $200 to meet the buyers at $200?
If the $300 holds then it won’t go to 200. But there can be for example just a small reaction, or no reaction to the $300. then the $200 is the next good support.
Tesla is only going up only .I don’t think they will drop so much.
So $300 didn’t hold and $200 is just below where TSLA is right now. Do you expect a bounce here, or because the HEAVIER volume around $300 didn’t hold, the LIGHTER volume at $200 is less likely to hold?
Hello HAVOLAS,
Right now could be a chance for an upmove. 2 reasons – heavy volumes and AB=CD setup (you can learn this one in my Volume Profile course = Elite Pack) or at least the basics of it here: https://www.trader-dale.com/abcd-a-simple-price-action-pattern-with-65-win-rate/