

When I started trading, I made one big mistake. I traded almost every day, but I did not record anything. I only looked at the final result: profit or loss. Today I know that a trading journal and detailed plan are the two tools that turn random results into real progress.
Here is the problem. If you do not know why you won or why you lost, you cannot improve. You cannot fine tune your strategy. You are just guessing. I stayed stuck in that loop for a long time, and I still see many traders doing the same thing today.
In this article, I draw on my years of trading and teaching traders to show you a simple, practical process. You will learn:
- Why watching only your equity curve hides the truth about your strategy
- What to record after every single trade
- How to read your data and find your best markets, days, and setups
- What a detailed trading plan must include
- Why your journal is useless if you do not follow your plan
I know journaling sounds boring. Writing rules sounds boring too. Most traders want to skip straight to the charts, and I was exactly the same. But there is no real substitute for your own data. Once you see what your numbers tell you, you stop guessing and start making decisions you can trust. Let us break it down step by step.
Table of Contents
Article in 5 Points
- Profit or loss alone tells you nothing about why a strategy works or fails.
- A trading journal reveals hidden strengths, such as your best market, day, or setup.
- Track the same data points on every trade: instrument, setup, time, day, and risk to reward ratio.
- Your journal data only means something if you follow a detailed trading plan 100%.
- Improve one thing at a time, based on your own data, not on feelings.
Why Profit and Loss Alone Cannot Replace a Trading Journal
The Equity Curve Trap
When I tested new strategies in the past, I did it all wrong. I only watched the equity curve. If it went up, I was happy. If it went down, I threw the strategy away and looked for a new one.
This feels logical, but it is a trap. An equity curve shows you the result. It does not show you the reason. Think of it like a school report that shows only your final grade. You know you failed, but you do not know which subject pulled you down. So you cannot study the right thing next time.

Good Strategies Often Fail for Hidden Reasons
Later I realized something important. Many strategies fail not because they are bad, but because we do not understand their strengths and weaknesses. A strategy is rarely just good or bad. It works well in some conditions and poorly in others.
Here is what can hide inside one equity curve:
- The strategy works great on EUR/USD, but not on indices.
- It does well on Wednesdays and Thursdays, but badly on Mondays.
- It needs a different time frame to work properly.
- One small filter could turn it from mediocre to profitable.
Look at how different the same month looks with and without a journal:
What You See Without a Journal | What You See With a Journal |
The strategy lost 4% this month | EUR/USD made 6%, indices lost 10% |
The win rate looks average | Wednesday and Thursday trades win far more often |
“This strategy does not work” | “It works on one market and needs a filter on others” |
If you throw the strategy away, you also throw away the part that works. The only way to find these hidden patterns is a proper trading journal with real data. Without it, I had no chance of improving anything. With it, you can keep what works and fix what does not.
What Should You Record in a Trading Journal?
The Data Points I Track on Every Trade
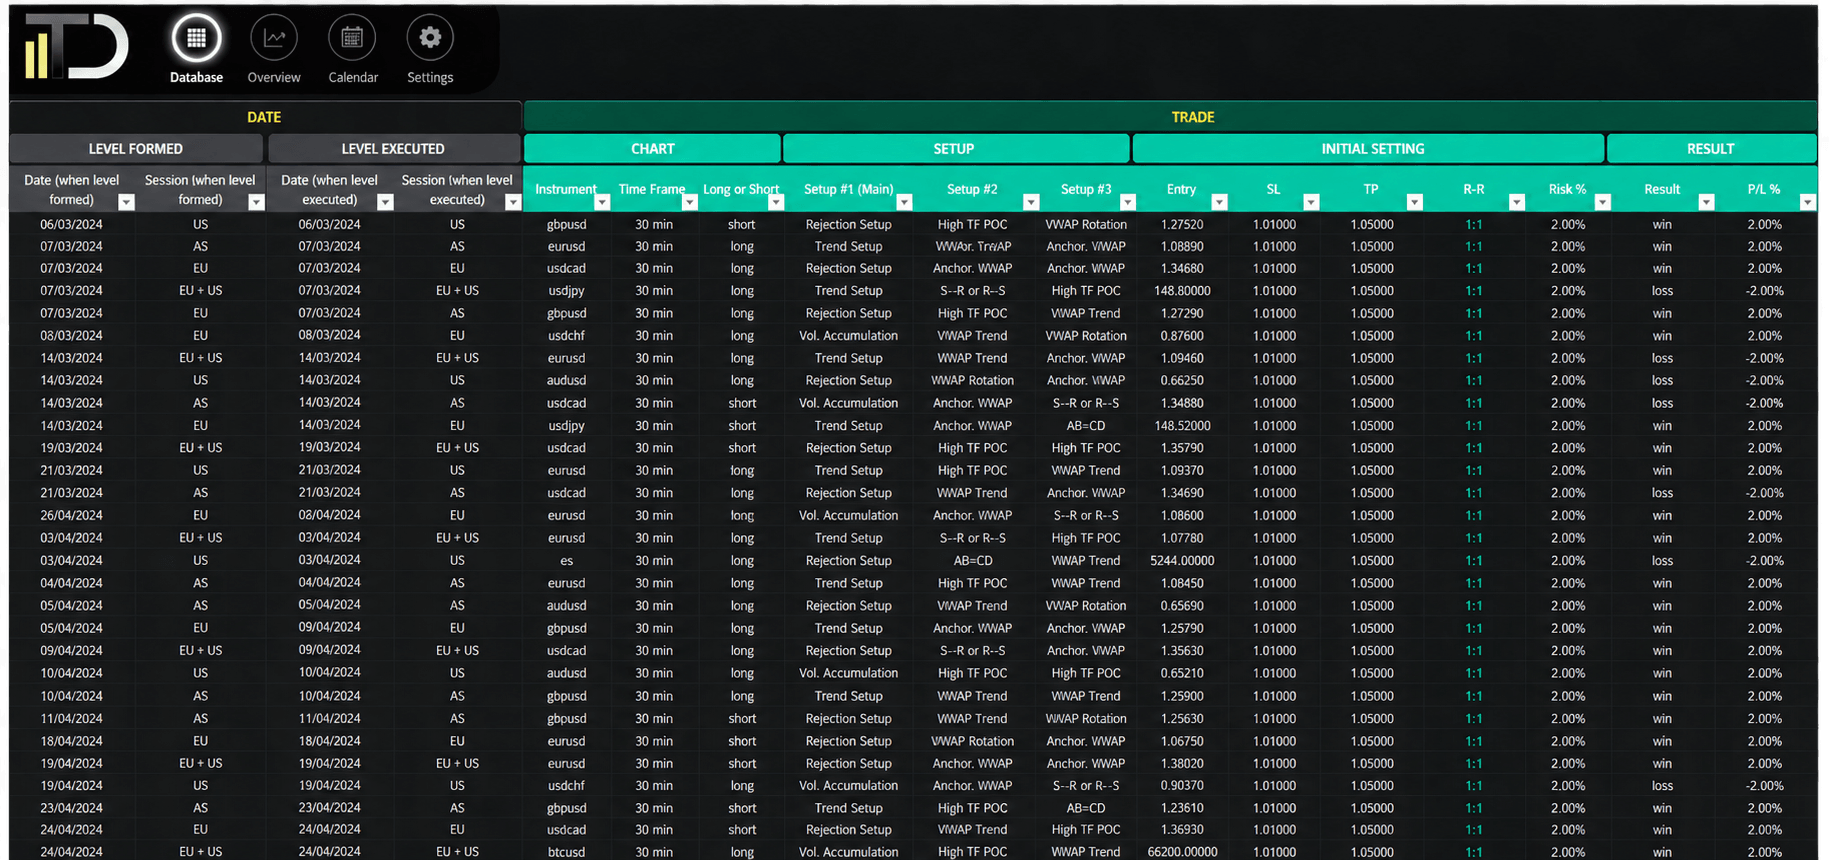
Today, I track everything. Every trade gets the same set of information. This is important, because you can only compare trades if you record them the same way.
Here is the basic structure I recommend:
Data Point | What You Write Down | Why It Matters |
Instrument | EUR/USD, Gold, S&P 500 | Shows which market suits your strategy |
Setup | The exact setup name from your plan | Shows which setup performs best |
Time of day | Entry time, for example 10:15 | Shows your best trading hours |
Day of week | Monday to Friday | Shows your strongest and weakest days |
Risk to reward ratio | For example 1:2 | Shows if your targets are realistic |
Result in R | For example 2R or minus 1R | Measures results in units of risk |
Followed plan? | Yes or No | Shows if the data is clean |
Screenshot and notes | A chart image and one short comment | Helps you remember the situation |
Let me explain “Result in R” because it is very useful. R means one unit of risk. If you risk $100 and make $200, the result is 2R. If you lose your full risk, the result is minus 1R. This lets you compare trades fairly, even if your account size changes over time.
Keep It Simple and Consistent
You do not need expensive software. A basic spreadsheet works perfectly. What matters is that you fill it in every time, with no exceptions.
A few simple rules help a lot:
- Fill in the journal right after the trade closes, while it is fresh in your mind.
- Use the same names for setups every time, so your filters work later.
- Save a chart screenshot of entry and exit.
- Never skip losing trades. They often teach you the most.
How Do You Turn Journal Data Into Better Decisions?
Ask Your Data Simple Questions
Collecting data is only half the job. The other half is asking the right questions. I use my journal data to find out:
- Which market gives me the highest return?
- On which days do I perform the best?
- Which setups have the best win rate?
- At what time of day do my trades work best?
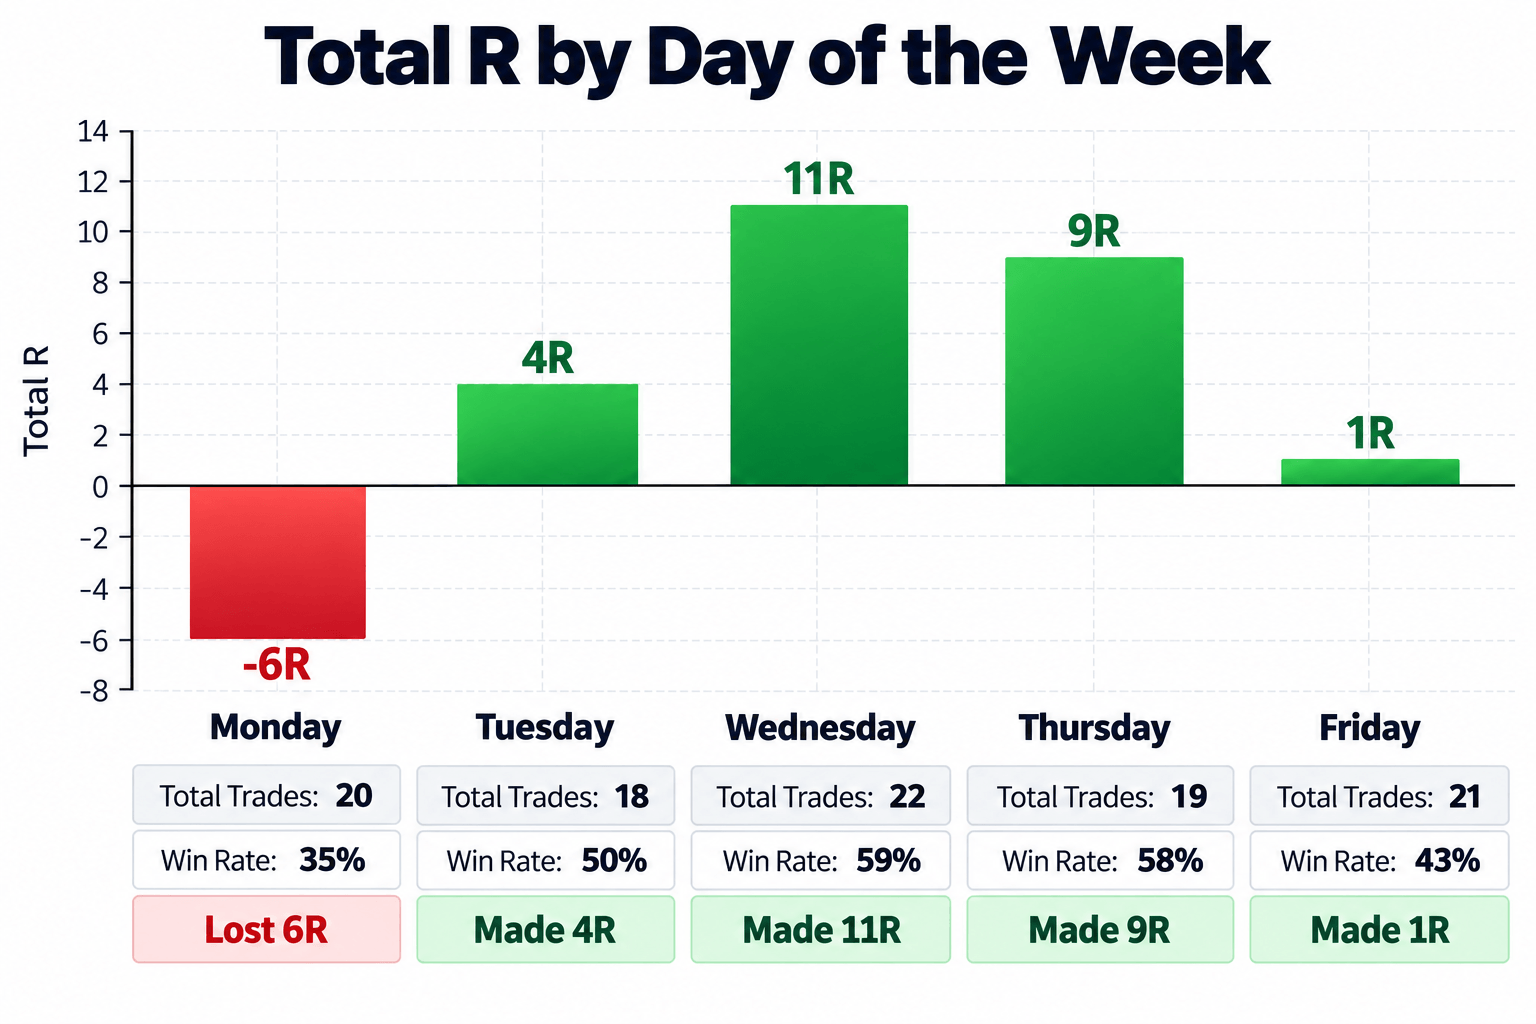
Here is an example of what a simple review by weekday might show:
Day | Number of Trades | Win Rate | Total Result |
Monday | 20 | 35% | Lost 6R |
Tuesday | 18 | 50% | Made 4R |
Wednesday | 22 | 59% | Made 11R |
Thursday | 19 | 58% | Made 9R |
Friday | 21 | 43% | Made 1R |
Now the picture is clear. Mondays are pulling the whole result down. Wednesdays and Thursdays carry the strategy. Without a journal, you would only see a small total profit and maybe think the strategy is weak.
Make Sure You Have Enough Trades
Be careful not to jump to conclusions too fast. Five trades on a Monday prove nothing. You need a decent number of trades before a pattern means anything. I like to see at least 20 to 30 trades in a group before I trust it.
Change Only One Thing at a Time
When you find a weak spot, fix one thing and test again. For example, stop trading on Mondays for the next 50 trades. If you change five things at once, you will not know which change helped. This is what I call data driven progress.
After 50 trades, compare the new numbers with the old ones. Did the overall result improve? Did the win rate go up? If yes, keep the change and write it into your plan. If not, remove it and test something else. Slowly, step by step, your trading journal and detailed plan grow into a strategy built on facts.
Why Your Trading Journal Needs a Detailed Plan
Random Decisions Create Random Data
Now, there is one more thing that goes hand in hand with journaling. You must have a clear trading plan, and you must follow it.
Why? Because if you do not follow your plan, the data in your journal becomes useless. It is no longer data about your strategy. It is data about random trading decisions.
Think about baking a cake. You have a recipe, but every time you bake, you change things. One day you add more sugar. Another day you bake it for less time. If the cake tastes bad, is the recipe bad? You cannot know, because you never actually followed it.
Trading works the same way. If you sometimes enter early, sometimes move your stop loss, and sometimes risk more because you “have a good feeling,” your journal will show mixed results. But those results do not describe your system. They describe your mood.

Testing a System Means Trading the System
If you want to test a system properly, you need to trade that system properly. This is the simple rule that changed everything for me.
Back when I started, I did write a trading plan. Most traders do, at least a basic version. But my plan was vague. It said things like “enter at strong support” without explaining what strong support looks like. So every decision still depended on how I felt that day.
To make real progress, your plan needs to be detailed and crystal clear. No guessing. No “I will decide later.” When the plan is clear, every trade follows the same rules. Then your journal collects clean data, and only then can you trust what the numbers tell you. That is why a trading journal and detailed plan must always work together.
What Goes Into a Detailed Trading Plan?
The Core Parts of a Clear Plan
A detailed plan answers every question before you open a trade. Here is a simple checklist you can use:
Plan Element | Question It Answers | Example |
Setups | Which setups do I trade? | Pullback to a Volume Profile level |
Entry rules | What exactly must the setup look like? | Price touches the level after a clear trend move |
Stop loss | Where do I place my stop? | A few pips behind the level |
Take profit | Where do I exit with a profit? | At a fixed 1:2 risk to reward ratio |
Risk per trade | How much do I risk? | 1% of my account |
Position management | What do I do during the trade? | No changes until stop or target is hit |
Drawdown rules | What do I do when I lose? | After a 5% drawdown, cut risk in half |
Markets and times | When and what do I trade? | EUR/USD, during the London session |
Each line must be specific enough that another trader could follow it. If someone else read your plan, would they take the same trade as you? If not, the plan needs more detail.
Follow It 100%
Writing the plan is step one. Following it 100% is step two, and this is where most traders fail. One rule broken here and there may not look like much. But each broken rule puts “noise” into your journal data.
This is why I added the “Followed plan?” column to my journal. It shows quickly how disciplined I really am. If many trades say “No,” I know the problem is not the strategy. The problem is me. You can read more about staying calm during losing periods in our guide on trading drawdowns article, and about keeping your risk stable in Same Risk Every Trade article.
How to Start Your Trading Journal and Detailed Plan Today
Why Traders Avoid This Work
Let us be honest. Traders hate journaling. It feels like extra work. It is boring. And writing rules sounds even more boring. Most traders want to skip straight to the fun part, which is placing trades.
That is exactly what I did when I started. I knew a trading plan and a journal were important. But I tried to do just the bare minimum, so I could get to the charts quickly. The result? No progress. I was stuck in the same loop, month after month.
Now I know the simple truth. Without a detailed trading plan and a proper journal, you cannot really improve. The boring work is the work that actually moves you forward. If it helps, read our article on trading strategy psychology to understand why this habit is so hard to build.
A Simple Five Step Routine
Here is the routine I recommend. It turns your trading into a repeatable process:
- Write a detailed trading plan. Use the checklist above. Leave nothing to “later.”
- Trade only what your plan allows. No extra trades because of a feeling.
- Record every trade in your journal. Same data points, every time.
- Review your data regularly. Look at markets, days, setups, and times.
- Improve one thing at a time. Then test it again with new data.
This routine takes only a few minutes per trade and maybe one hour per week for review. That small effort is what makes your trading journal and detailed plan truly useful.

Repeat this cycle and your results start to make sense. Each round gives you cleaner data and a sharper plan. You stop guessing, and you start building on facts. If you want to learn more about how good decisions are measured over many trades, the idea of [External link: Wikipedia, Expected value] is a helpful place to start.
Final Thoughts
Let me bring it all together. When I started trading, I only looked at profit or loss. Because I did not know why I won or why I lost, I could not improve. Strategies that might have worked with one small change ended up in the bin. I was guessing, and guessing kept me stuck
What finally broke that cycle was simple. A trading journal and detailed plan. The plan tells you exactly what to do. The journal records what actually happened. Together, they give you real data you can trust.
With that data, you can answer powerful questions:
- Which market gives me the best return?
- On which days should I trade, and which should I skip?
- What setups deserve more attention?
- Do I really follow my own rules?
Yes, this work feels boring at first. Yes, it takes time. But there is no shortcut and no substitute. Every serious improvement I made came from my own numbers, not from a new indicator or a lucky week.
So here is my advice. Write a detailed trading plan. Follow it. Track everything. Then improve using your own data. Do this for a few months and you will see your strategy in a completely new way. You will understand its strengths, its weaknesses, and exactly where to fix it. That is how you turn trading into a clear, professional process.
Frequently Asked Questions
How many trades do I need before my journal data is useful?
Aim for at least 20 to 30 trades in each group you want to compare. Fewer trades can show patterns that are just luck.
Can I use a simple spreadsheet as a trading journal?
Yes. A spreadsheet is all you need. What matters is that you record the same data points on every single trade.
What if I break my trading plan rules?
Mark the trade as “Not followed” in your journal. Then review these trades separately, so they do not mix with clean data about your strategy.
Ready to Build Your Trading Process?
Start today. Write down your trading plan, open a simple spreadsheet, and record your next trade. If you want ready made setups with clear rules for entry, stop loss, and take profit, explore the Trader Dale courses and start trading with a plan you can actually measure. Apply my coupon code KEVIN10 to get a 10% discount on any course pack.