
In today’s analysis, I am going to have a closer look at AUD/CAD. There was strong macroeconomic news released in the Asian session today. It was the AUD Cash Rate and RBA Rate Statement. Then later, there was the Annual Budget Release.
All those were strong news which affected the AUD and caused the strong sell-off.
When there is a new trend like we see now, I am always interested in what happened before the trend started.
Volume Profile Analysis
In this case, there was a rotation in which pretty heavy volumes were traded. This indicates that the big guys (big financial institutions) were entering their trading positions there.
At that point, it was not clear whether those positions were Long or Short positions. Only after the strong post-macro sell-off, it became clear that the big guys were entering Shorts.
AUD/CAD, 30 Minute chart:
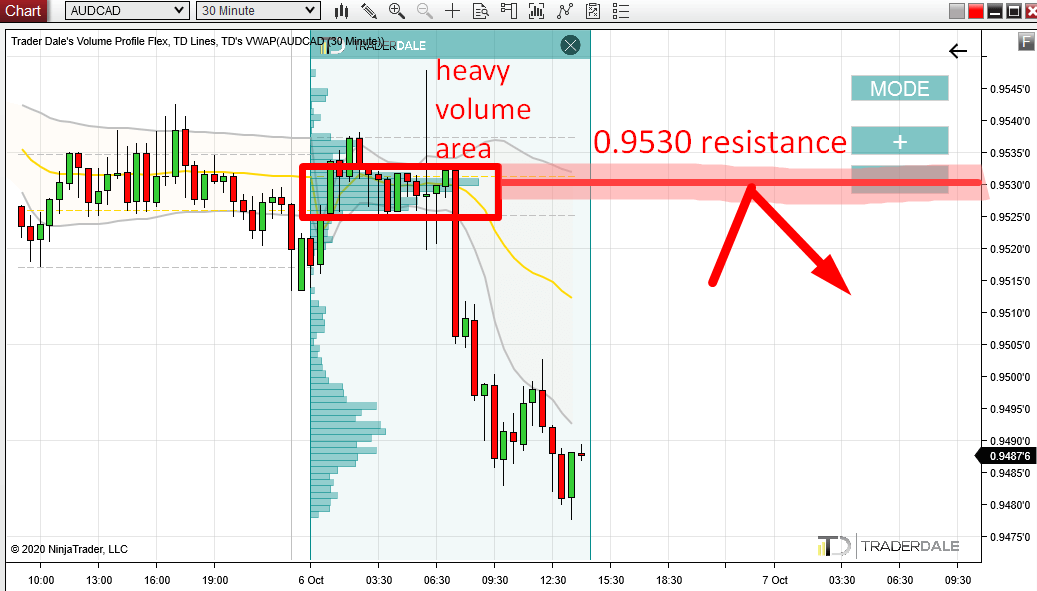
This represents a nice trading opportunity. When the price makes it back into the heavy volume area, it is likely that it will work as a strong Resistance because the big guys will want to defend their Short positions.
They placed most of them at 0.9530 (that’s the POC of the rotation) and this is also the place where the price is most likely to turn.
Order Flow Analysis
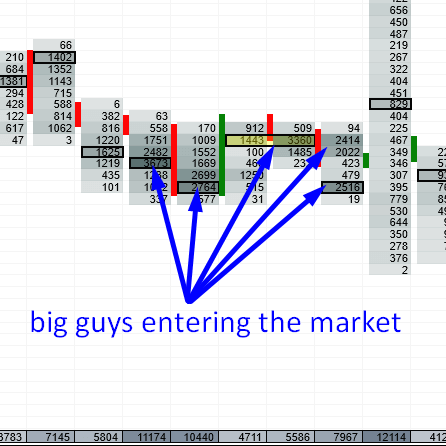
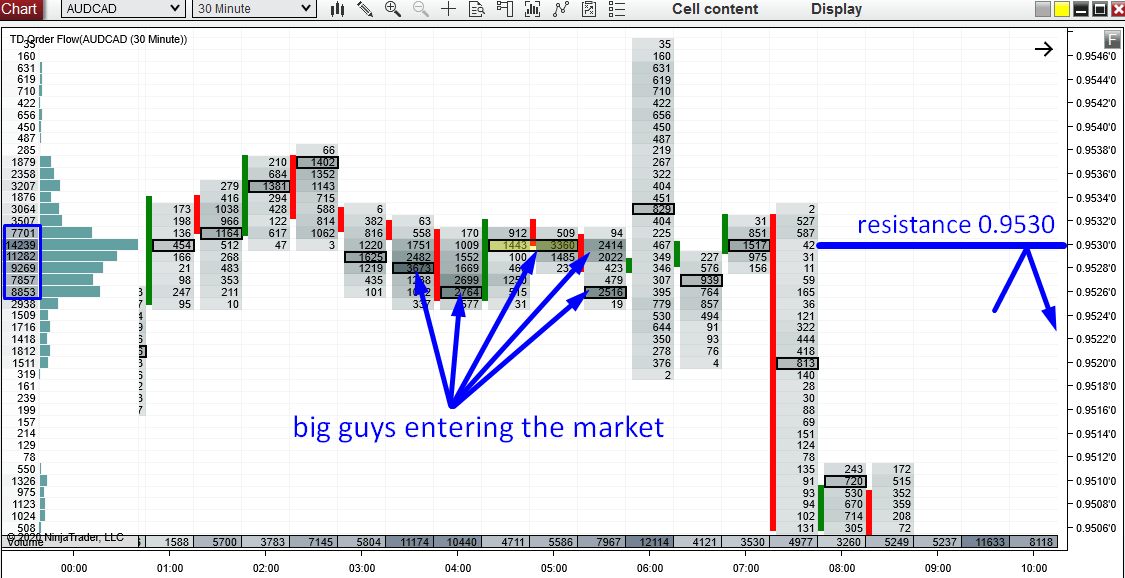
Those big guys who were entering their Shorts are also very nicely visible on my Order Flow software. If you look at the picture below, you can see the huge volumes (huge numbers) the big guys were entering in the rotation before the macro news.
AUD/CAD, 30 Minute Order Flow chart. All numbers x100.000:
Do you want ME to help YOU with your trading?
Weekly POC
Those big guys weren’t entering their Shorts only a few hours before the news release, but also through the whole previous week.
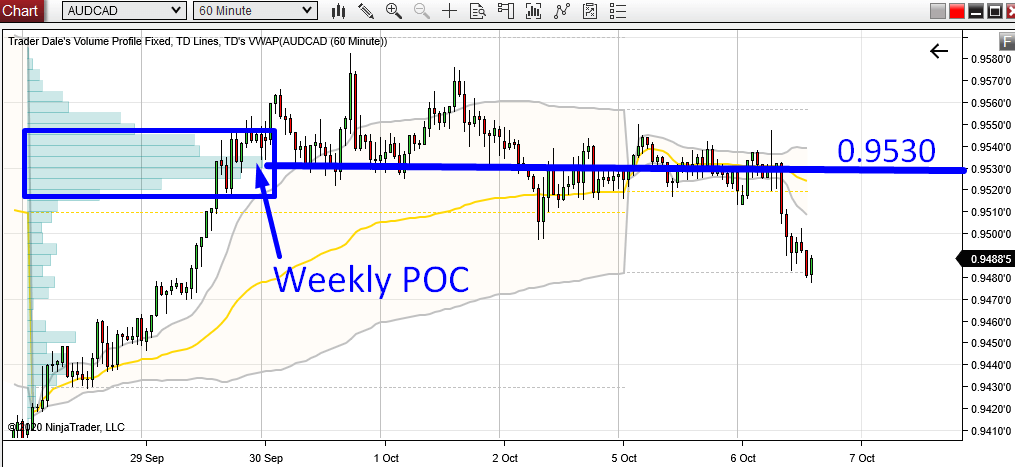
It is nicely visible if you look at the Weekly Volume Profile.
Our level at 0.9530 represents Weekly Point Of Control (POC) which is a strong level just by itself. It tells us that the heaviest volumes in the previous week were traded exactly at 0.9530.
In our case, having a Weekly POC at our resistance level is a very nice confluence and confirmation.
AUD/CAD, 60 Minute chart with Weekly Volume Profile:

I hope you guys liked today’s analysis! Let me know what you think in the comments below.
Happy trading!
-Dale