
In this trade analysis, I would like to review trades based on strong trading levels I showed you on Monday in my Weekly Trading Ideas Video.
I was talking about four strong support and resistance levels, from which three got already tested yesterday.
If you missed the video with the predictions, you can watch it here:
Lets now have a look at the trades one-by-one and see how they went!
EUR/GBP 0.9112 Short
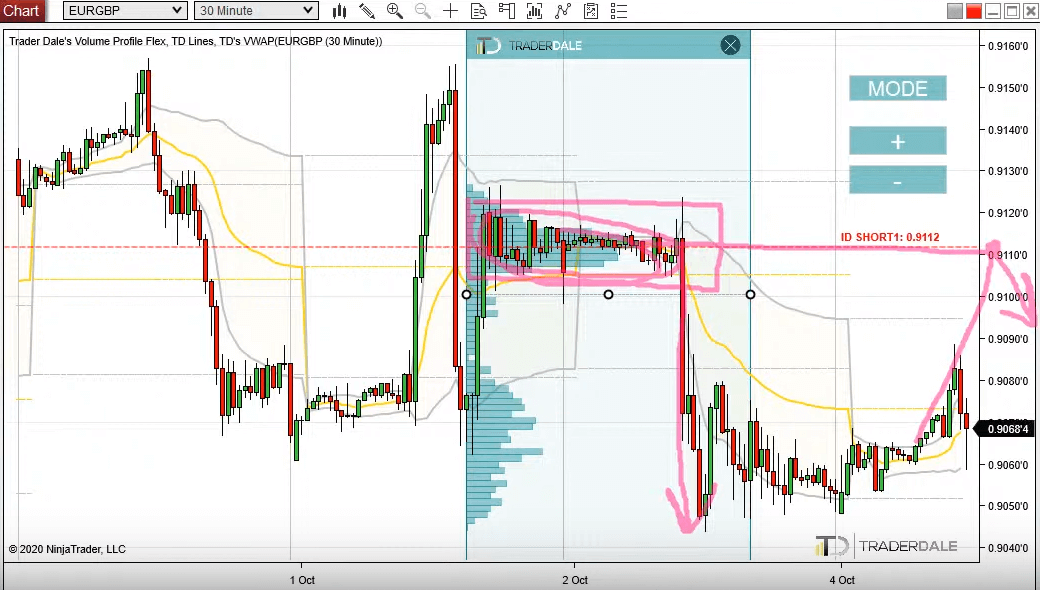
This level was based on one of my most favorite Volume Profile setup called the “Volume Accumulation Setup“. You can see the prediction I made on the screenshot below:
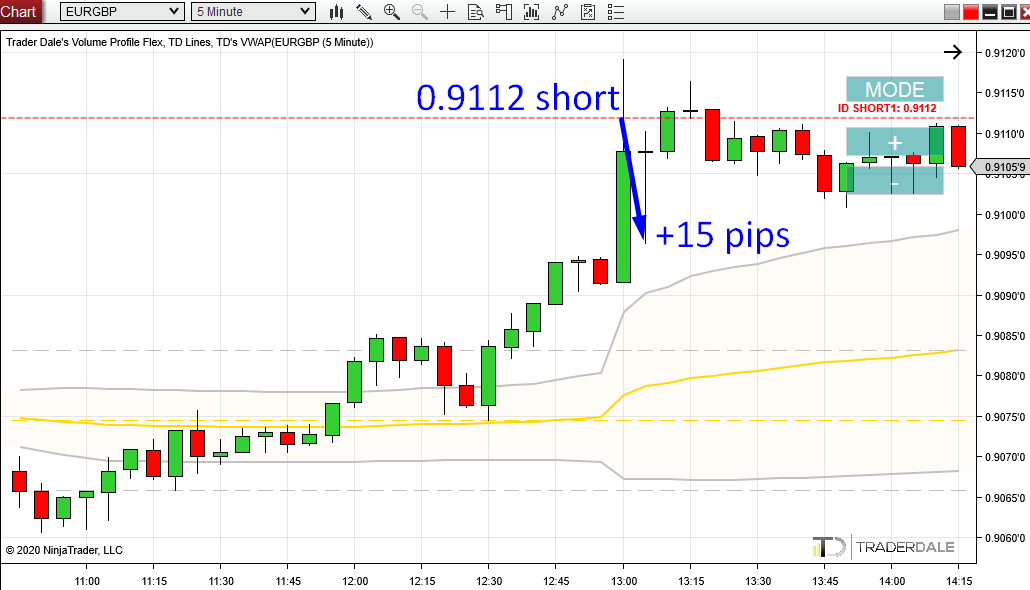
This resistance was hit yesterday and there was a super quick reaction to it. The trade was over in just a couple of minutes with a potential of +15 pips. If you held the trade longer you could have taken more. However, +15 pips is more than enough for an intraday trade on a forex pair with so low volatility as EUR/GBP.
The picture below shows the reaction to the resistance.
EUR/GBP, 5 Minute chart:
NZD/USD 0.6588 Long, and 0.6579 Long
The next strong trading level I was talking about was a support on NZD/USD at 0.6588.
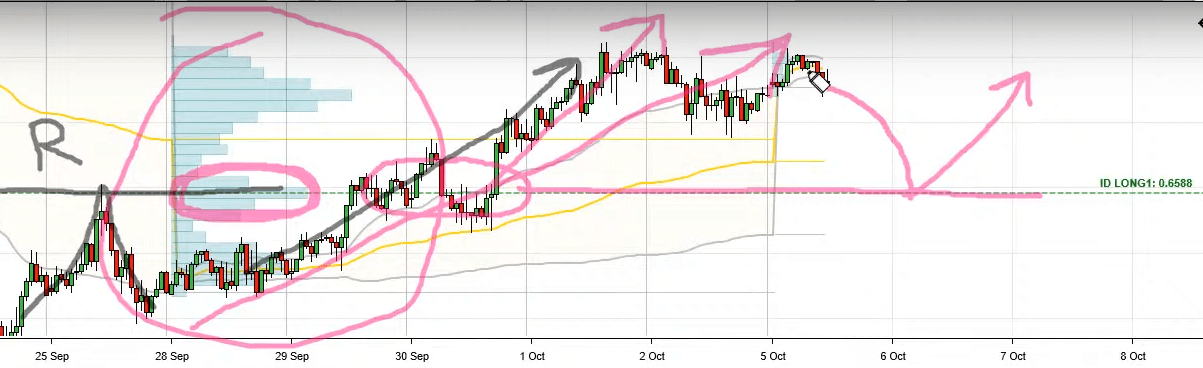
This one was based on a combination of two trading setups.
The first was a Volume Profile setup called the “Trend Setup” and the second one was a Price Action setup which I call “Support Becoming Resistance Setup“.
The chart below shows the prediction I made on a 60 Minute chart:
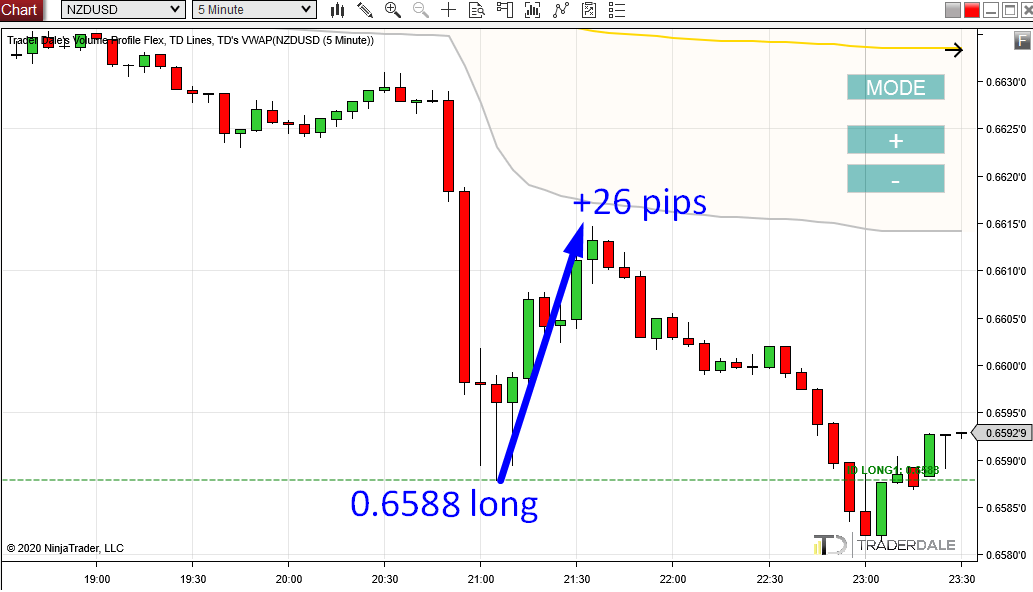
The reaction to this level came in the late US session yesterday. It was very precise and the maximum you could quickly take from this trade was +26 pips.
NZD/USD, 5 Minute chart:
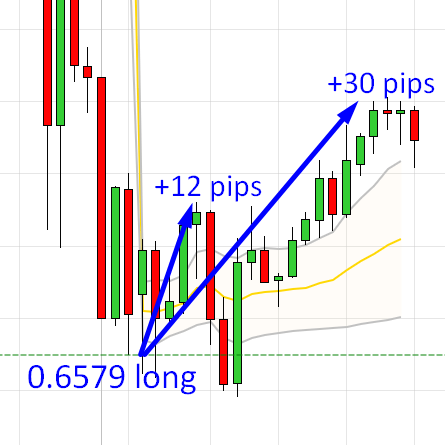
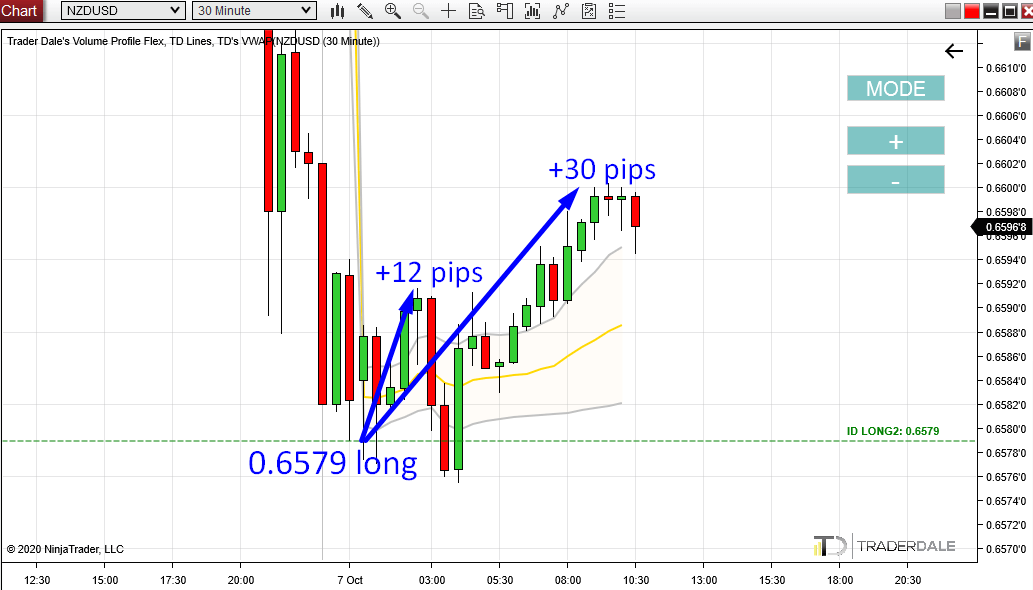
In the video, I also said that if you preferred tighter Stop Loss, you could also take this trade a bit lower, from 0.6579.
There was also a nice reaction to this support and the price first made a +12 pip reaction, and if you held the trade longer, then +30 pip reaction (so far).
NZD/USD, 30 Minute chart:
Do you want ME to help YOU with your trading?
Join one of my Volume Profile Educational courses and get my private trading levels, 15 hours of video content, my custom made Volume Profile indicators, and more!
Click Here
NZD/CAD 0.8767 Long
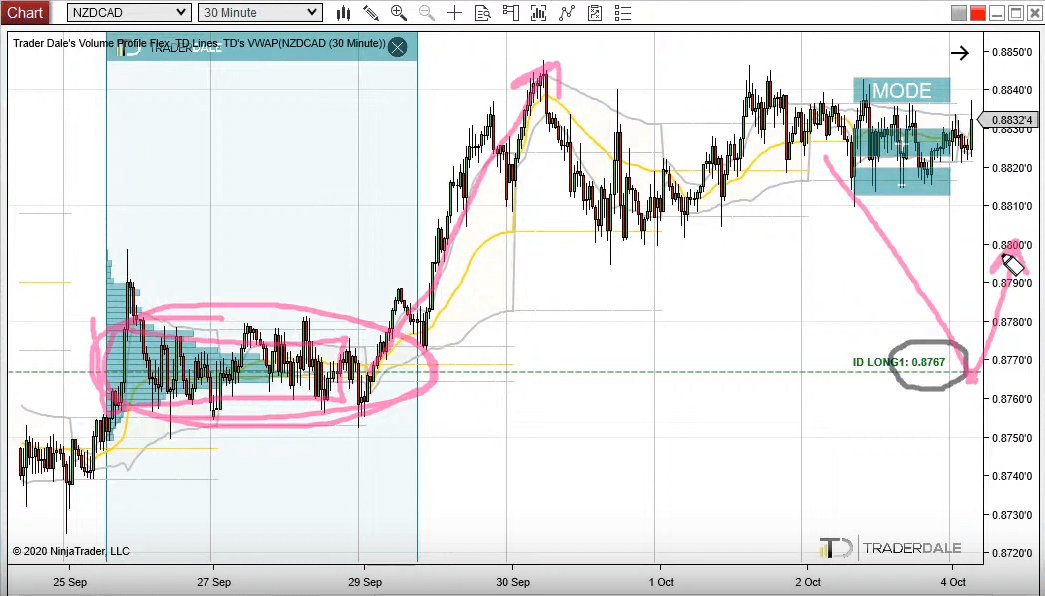
This strong support was based on my “Volume Accumulation setup“. There were massive volumes placed in the market around 0.8767 (that was the POC of the volume zone). A support like this is hard to ignore.
Below is a screenshot from the video I made on Monday:
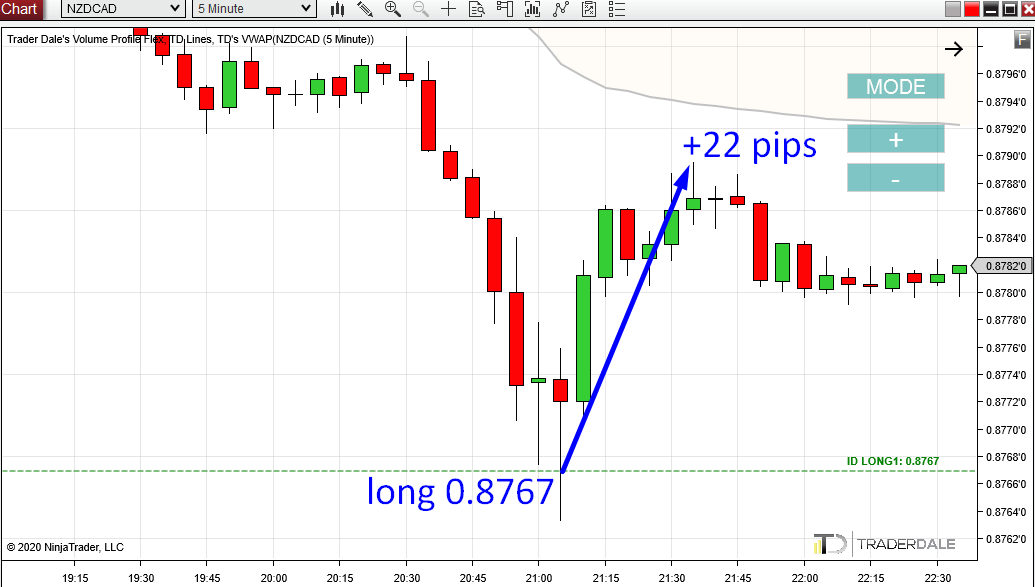
And this was the reaction! The price hit this level and turned sharply making a nice pinbar. The maximum you could have taken from this trade was +22 pips, which is more than enough for an intraday trade.
NZD/CAD, 5 Minute chart:
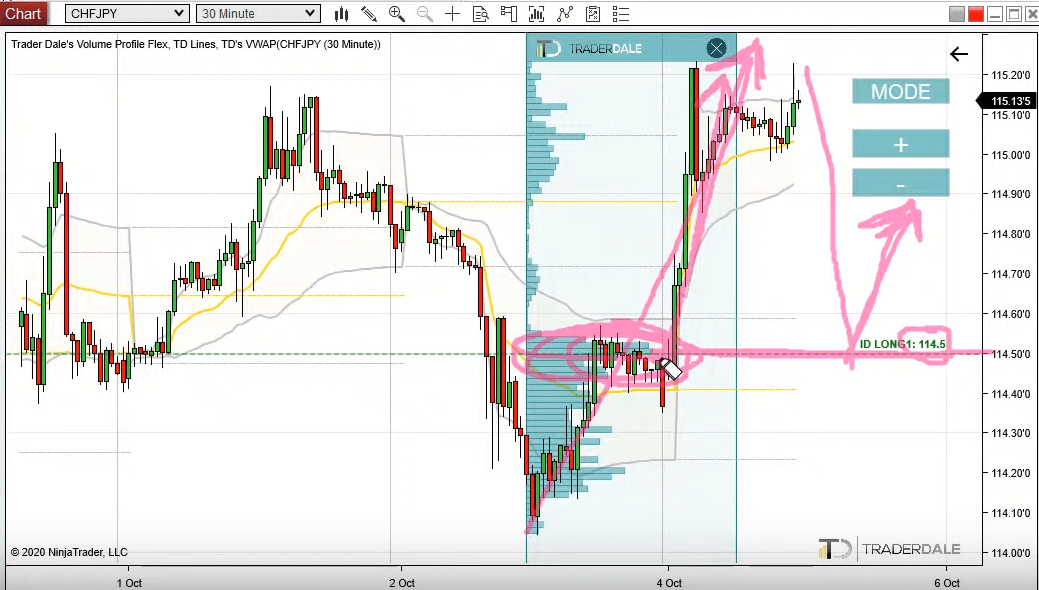
CHF/JPY 114.50 Long
The last strong level I mentioned was a support on CHF/JPY. The price has not reached this level yet, so it still remains active.
All the other levels I talked about are already spent.
CHF/JPY, prediction (30 Minute chart):
I hope you guys liked this trade analysis! Let me know what you think in the comments below.
Happy trading!
-Dale
