There was an unexpected announcement made in today’s Asian session. It was said that the trade deal between US and China would be terminated.

Price Action
This news caused some pretty wild movement all over the markets. One of the most active currency futures in the Asian session is the 6A (AUD/USD futures) so let’s have a look at what happened there!
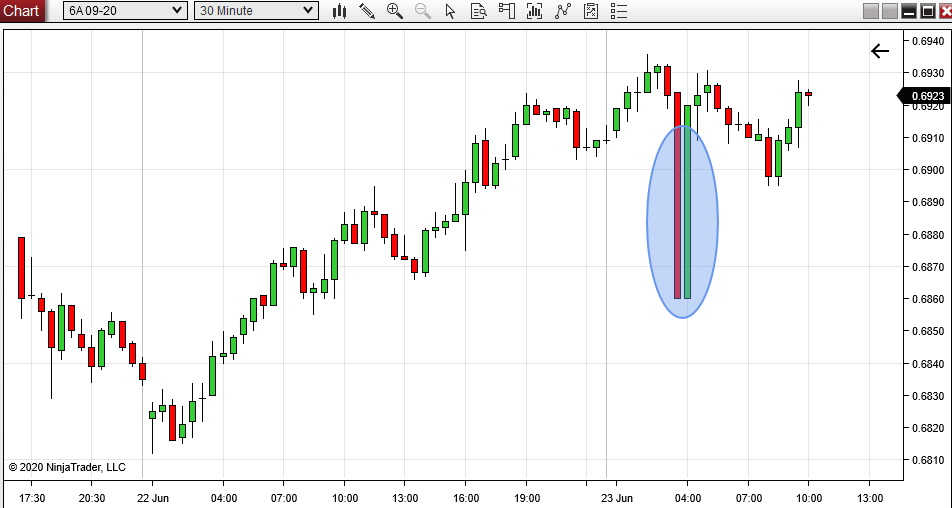
If you look at the price action chart below, you can see that there was a 70 pip spike. Unfortunately, this is all what the price chart can tell us. It can’t predict the turning point of this spike (it’s low). So, if you are trading in a situation like this, then simple price action won’t really help you.
Order Flow analysis
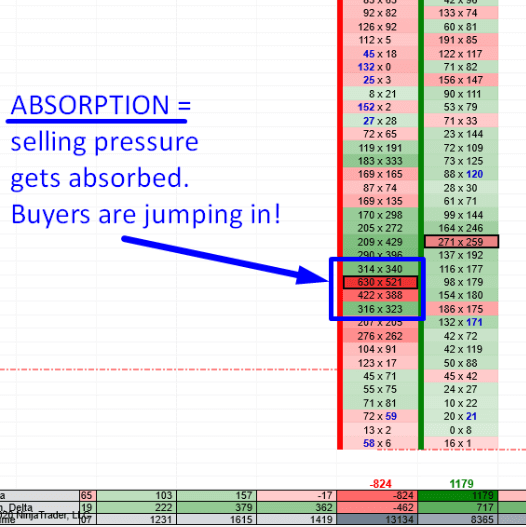
What can help you however, is the Order Flow! If you look at the picture below, you will see the detail of the price spike the AUD made.
There were massive volumes traded a little bit above the turning point. Those volumes were traded on Bid as well as on Ask. What it means is this:
Sellers were pushing the price aggressively downwards. They did so by placing aggressive Market orders. What happened next was that buyers started to show up and they started to absorb the selling pressure. This means that even though the aggressive sellers were jumping in with Market orders, the buyers were able to buy all the selling pressure.
This is called the “Absorption“. It usually occurs around turning points and the main sign is that you see massive volumes appear both on Bid and also on Ask of the footprint.
I marked that in the picture below. The main thing to notice is the unusually heavy volumes both on Bid and on Ask.
6A 09-20 (AUD futures), 30 Minute Order Flow chart:

Price and Delta Divergence
Apart from the Absorption, there was also one more very important signal telling you that the price was likely to turn. It was a divergence between price and Delta.
Simply put, what Delta shows the difference between aggressive buyers and aggressive sellers.
In the picture below you can see that the price went downwards, but by that time the Delta has already turned upwards. This is called the “divergence between price and delta“.
In this case it told us, that even though the price was going downwards, buyers were entering their positions!
In a situation like this the price usually follows Delta. That’s why this divergence was another signal that the price would most likely turn.
6A 09-20, 1 Minute chart:

Summary
To sum this up – when the price of the AUD went downwards sharply today, there were two signals that the price would turn up again:
First, the Absorption which was telling us that buyers were absorbing the selling pressure.
Second, a divergence between Price and Delta telling us that even though the price was dropping, more and more buyers were jumping in and that the price was likely to turn upwards again.
Where to get Order Flow & Delta
You can get my custom made Order Flow + Delta here:
TD Order Flow Software & Training – Click Here
The Order Flow Package includes Lifetime Access To:
- Order Flow software
- Order Flow Video Course (12 hours long)
- Volume Profile Pack
Additionally, you can get our proprietary Order Flow software as a standalone product via the Order Flow page I’ve linked to above.
Happy trading!
-Dale
