

Hello guys,
I had some requests to do a Bitcoin analysis using Volume Profile so here we go! But first, let’s talk Price Action.
Price Action Analysis
BTC/USD is at its all-time highs right now. If it is to continue to move upwards, however, it is very likely that it will make a little pullback first.
Why a pullback? It needs to close the huge gap it created on the 30th of November.
In general, markets tend to close such opening gaps. In most cases, they get closed as they are something not too natural for markets with good liquidity – like currencies, or cryptocurrencies (at least the more liquid ones).
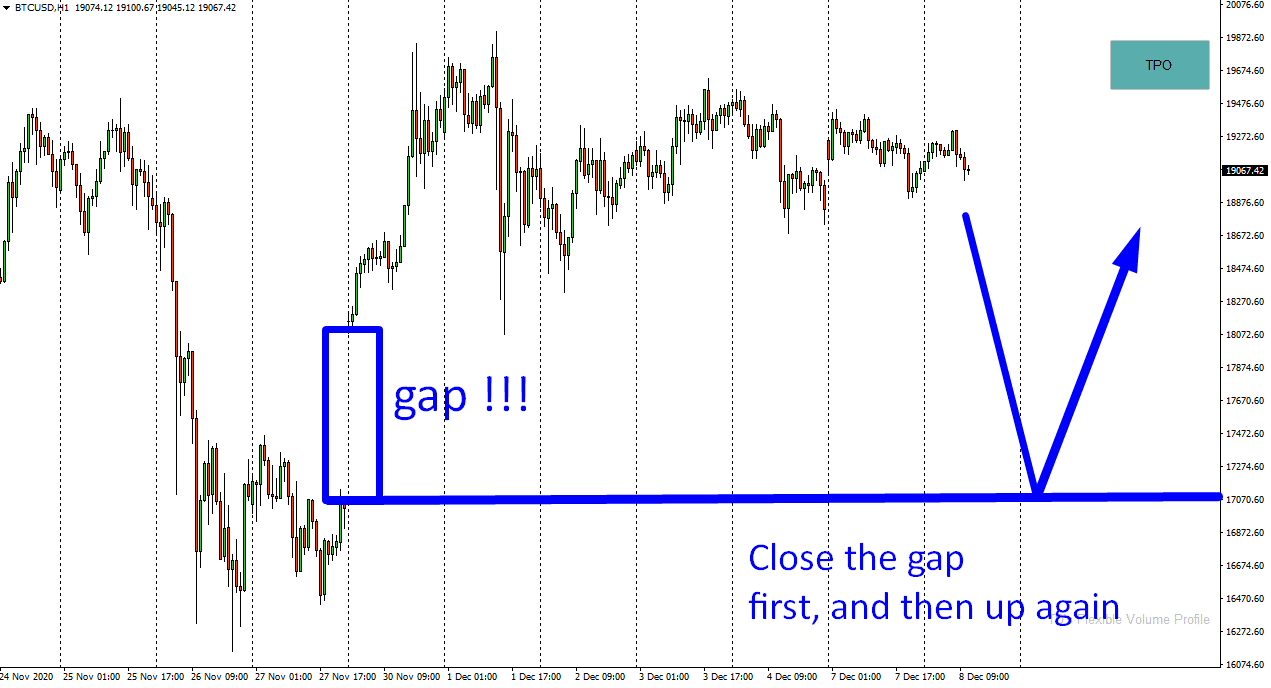
In this case, based just on the Price Action, the most likely scenario is that the price will make a pullback to 17080 and then go up again. This is how markets generally react to such opening gaps.
First, close the gap, then turn the price.
The 1 Hour chart of BTC/USD below shows how it should look like. Keep in mind that we don’t know when the price will make this pullback and closes the gap as we also don’t know if the price won’t make it higher before closing the gap!
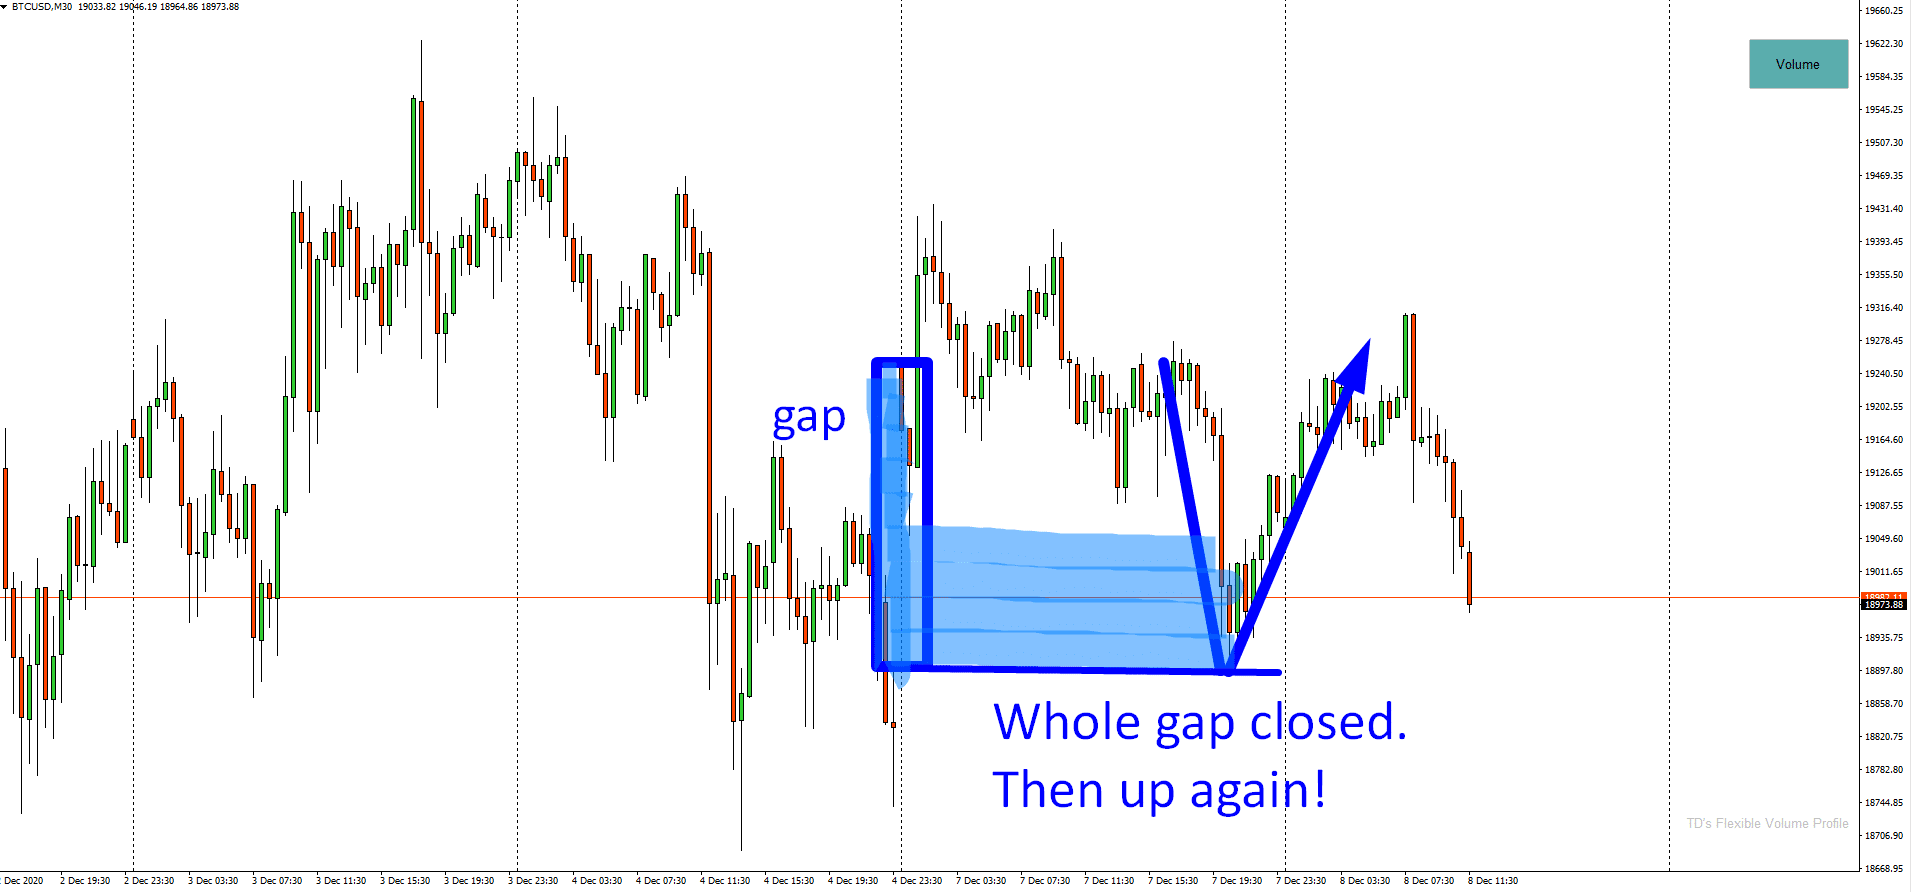
BTW. If you look at the BTC/USD chart below, you can see that there actually was exactly this scenario yesterday! There was a market open with a gap and before the day was over, the gap got closed. This was followed by an immediate buying reaction. Here is a screenshot:
So, that’s the gap and how the price usually reacts to it. But there is more. To be able to see it, we need to use Volume Profile!
Do you want ME to help YOU with your trading?
Volume Profile Analysis
If you look into the strong rejection of lower prices the BTC made using Volume Profile, then you will see that there were quite heavy volumes traded right before the huge opening gap.
Those volumes should now work as a strong support. Strong buyers who invested there in BTC will want to defend this area!
That’s why the price should react to this heavy volume zone when the price reaches here at some point in the future.
Below is a 1 Hour chart of BTC/USD:

The cool thing about all this is the confluence of the two trading setups. Price Action gap setup and the Volume Profile setup. Together, both setups point to a strong support around 17080.
What if the BTC does not close the gap?
If the price does not close the gap, and leaves it there then it is a sign of really aggressive buyers who won’t even allow the pullback and who will push the price even higher.
So, if the gap does not get closed, we can expect the prices of BTC shoot through the roof!
BTW. This analysis was done using MT4 platform and my Flexible Volume Profile indicator. You can get the indi here, just for $49:
I hope you guys liked the analysis. Let me know what you thing of it and of Bitcoin in the comments below!
Happy trading!
-Dale

Thank you Dale, very much appreciated
My pleasure Karl!
Can you show us from where MetaTrader or NinjaTrader can get crypto data for free? Thank you!
Hi Marko, on MT4 you just need a broker that has it, and on NT8 you can connect to your Coinbase account (no need to have funds there). 🙂
Thank you Dale. Data on NT8 from Coinbase is also tick data or minute data like on MT4?
Works like a Charm. You don’t even have to have an account as I choose Coinbase from the connections menu and there is no username/password fields to fill.
Thanks Dale, you explain very well about trading, i’m new one on tading, but i am learning a lot with you.
You’re most welcome Armenio, I’m glad to hear that!
Qual eh a Timeframe que usas para Daytrade